| Red | Green | Blue | |
| z | 17.64 | ||
| znorm | Inf | ||
| sky | -Inf | -Inf | -Inf |
| S/N | 26.3 | 39.3 | 45.1 |
| S/N(c) | 25.5 | 37.4 | 44.3 |
| SN(E/C) |

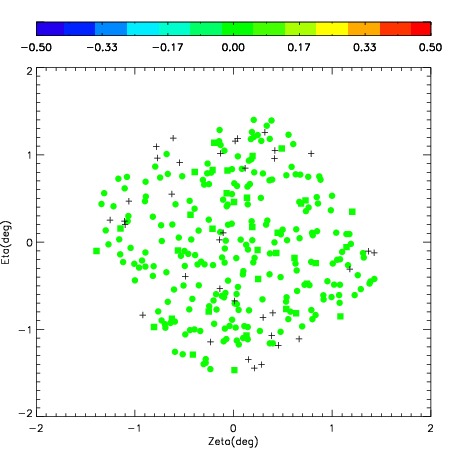
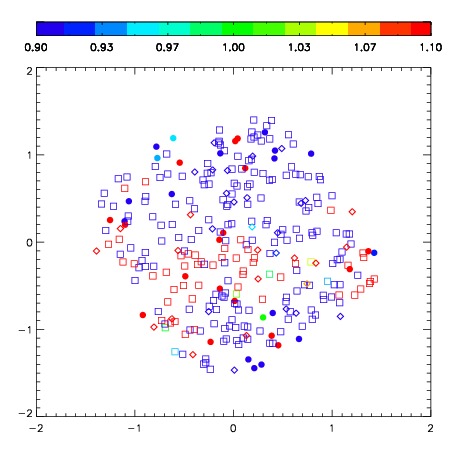


| Frame | Nreads | Zeropoints | Mag plots | Spatial mag deviation | Spatial sky 16325A emission deviations (filled: sky, open: star) | Spatial sky continuum emission | Spatial sky telluric CO2 absorption deviations (filled: H < 10) | |||||||||||||||||||||||
| 0 | 0 |
|
|
|
|
|
|
| IPAIR | NAME | SHIFT | NEWSHIFT | S/N | NAME | SHIFT | NEWSHIFT | S/N |
| 0 | 05150064 | 0.336654 | 0.00000 | 207.205 | 05150063 | 0.00000 | 0.336654 | 205.551 |
| 1 | 05150068 | 0.296329 | 0.0403250 | 202.592 | 05150067 | -0.0241133 | 0.360767 | 203.714 |
| 2 | 05150065 | 0.328093 | 0.00856102 | 201.833 | 05150066 | -0.0201237 | 0.356778 | 202.202 |