| Red | Green | Blue | |
| z | 17.64 | ||
| znorm | Inf | ||
| sky | -NaN | -Inf | -Inf |
| S/N | 17.0 | 27.8 | 34.8 |
| S/N(c) | 0.0 | 0.0 | 0.0 |
| SN(E/C) |

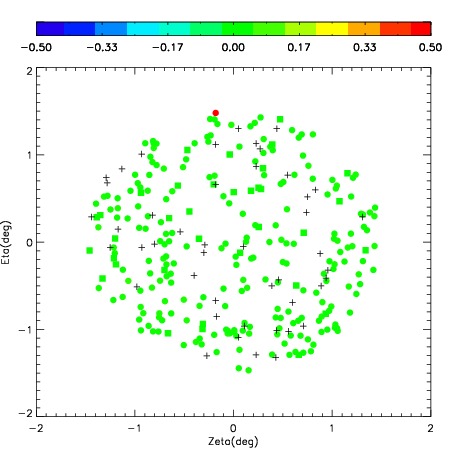
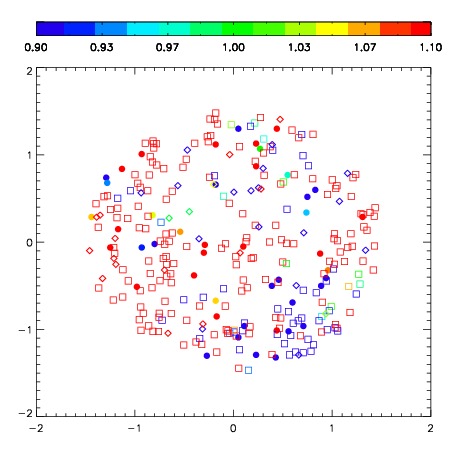


| Frame | Nreads | Zeropoints | Mag plots | Spatial mag deviation | Spatial sky 16325A emission deviations (filled: sky, open: star) | Spatial sky continuum emission | Spatial sky telluric CO2 absorption deviations (filled: H < 10) | |||||||||||||||||||||||
| 0 | 0 |
|
|
|
|
|
|
| IPAIR | NAME | SHIFT | NEWSHIFT | S/N | NAME | SHIFT | NEWSHIFT | S/N |
| 0 | 02560018 | 0.372206 | 0.00000 | 194.146 | 02560017 | 0.00669464 | 0.365511 | 202.981 |
| 1 | 02560015 | 0.365051 | 0.00715500 | 168.429 | 02560016 | 0.00436161 | 0.367844 | 179.636 |
| 2 | 02560019 | 0.365183 | 0.00702301 | 164.256 | 02560013 | 0.00000 | 0.372206 | 173.088 |
| 3 | 02560014 | 0.368965 | 0.00324100 | 149.172 | 02560020 | 0.00515269 | 0.367053 | 138.395 |