| Red | Green | Blue | |
| z | 17.64 | ||
| znorm | Inf | ||
| sky | -Inf | -Inf | -Inf |
| S/N | 29.3 | 43.6 | 51.8 |
| S/N(c) | 0.0 | 0.0 | 0.0 |
| SN(E/C) |
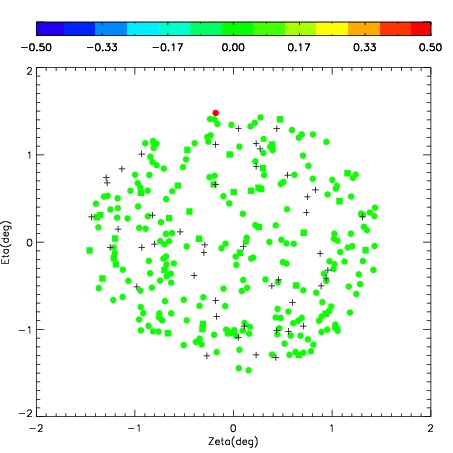

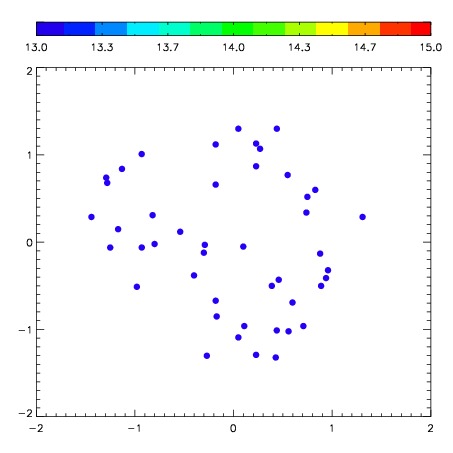
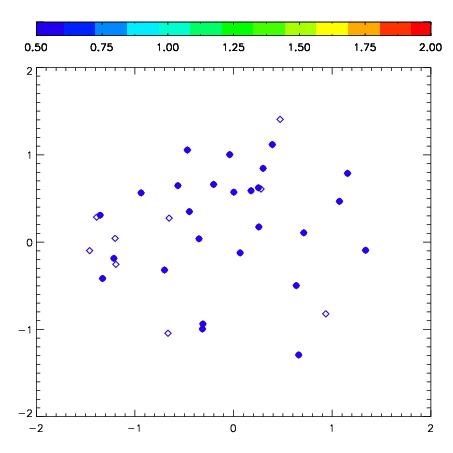
| Frame | Nreads | Zeropoints | Mag plots | Spatial mag deviation | Spatial sky 16325A emission deviations (filled: sky, open: star) | Spatial sky continuum emission | Spatial sky telluric CO2 absorption deviations (filled: H < 10) | |||||||||||||||||||||||
| 0 | 0 |
|
|
|
|
|
|
| IPAIR | NAME | SHIFT | NEWSHIFT | S/N | NAME | SHIFT | NEWSHIFT | S/N |
| 0 | 05220054 | 0.497842 | 0.00000 | 272.961 | 05220051 | 0.00000 | 0.497842 | 269.284 |
| 1 | 05220057 | 0.494415 | 0.00342703 | 280.413 | 05220055 | -0.00293971 | 0.500782 | 284.116 |
| 2 | 05220058 | 0.495400 | 0.00244200 | 273.590 | 05220056 | 0.000149220 | 0.497693 | 280.897 |
| 3 | 05220053 | 0.496971 | 0.000871003 | 268.813 | 05220052 | 0.00000 | 0.497842 | 269.027 |