| Red | Green | Blue | |
| z | 17.64 | ||
| znorm | Inf | ||
| sky | -Inf | -Inf | -Inf |
| S/N | 24.1 | 37.1 | 43.0 |
| S/N(c) | 0.0 | 0.0 | 0.0 |
| SN(E/C) |

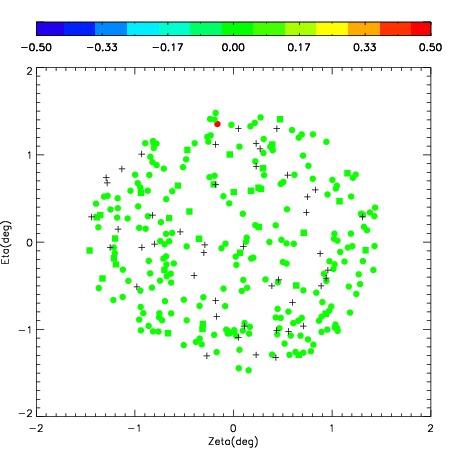
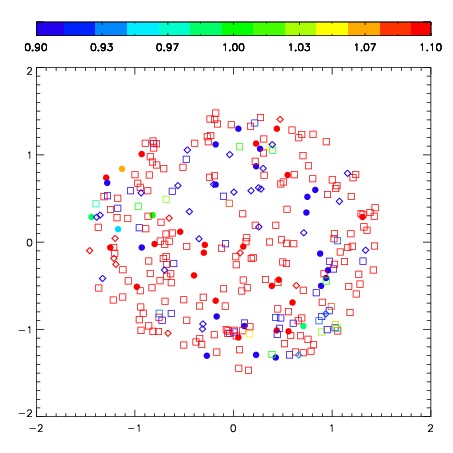


| Frame | Nreads | Zeropoints | Mag plots | Spatial mag deviation | Spatial sky 16325A emission deviations (filled: sky, open: star) | Spatial sky continuum emission | Spatial sky telluric CO2 absorption deviations (filled: H < 10) | |||||||||||||||||||||||
| 0 | 0 |
|
|
|
|
|
|
| IPAIR | NAME | SHIFT | NEWSHIFT | S/N | NAME | SHIFT | NEWSHIFT | S/N |
| 0 | 08490061 | 0.574792 | 0.00000 | 273.926 | 08490063 | 0.0904055 | 0.484387 | 278.556 |
| 1 | 08490060 | 0.566507 | 0.00828505 | 272.666 | 08490062 | 0.0829415 | 0.491851 | 272.209 |
| 2 | 08490064 | 0.559315 | 0.0154770 | 269.417 | 08490059 | 0.00000 | 0.574792 | 268.666 |