| Red | Green | Blue | |
| z | 17.64 | ||
| znorm | Inf | ||
| sky | -Inf | -Inf | -Inf |
| S/N | 25.9 | 41.8 | 44.1 |
| S/N(c) | 0.0 | 0.0 | 0.0 |
| SN(E/C) |
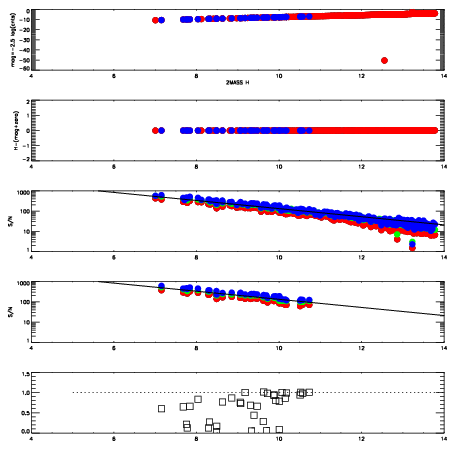
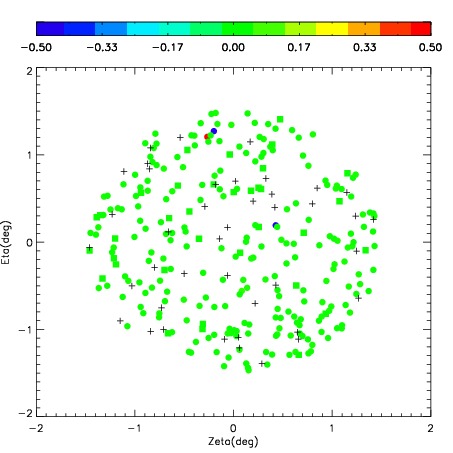

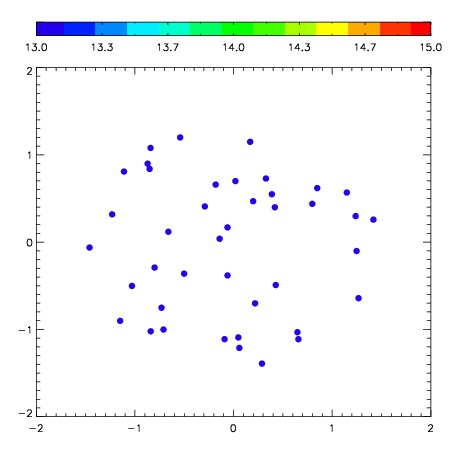
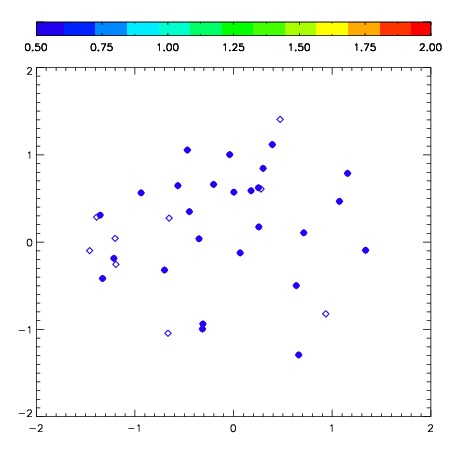
| Frame | Nreads | Zeropoints | Mag plots | Spatial mag deviation | Spatial sky 16325A emission deviations (filled: sky, open: star) | Spatial sky continuum emission | Spatial sky telluric CO2 absorption deviations (filled: H < 10) | |||||||||||||||||||||||
| 0 | 0 |
|
|
|
|
|
|
| IPAIR | NAME | SHIFT | NEWSHIFT | S/N | NAME | SHIFT | NEWSHIFT | S/N |
| 0 | 08500071 | 0.590150 | 0.00000 | 257.813 | 08500074 | 0.100564 | 0.489586 | 261.125 |
| 1 | 08500075 | 0.564199 | 0.0259510 | 265.239 | 08500073 | 0.107766 | 0.482384 | 261.722 |
| 2 | 08500072 | 0.582772 | 0.00737798 | 255.737 | 08500069 | 0.111298 | 0.478852 | 251.680 |
| 3 | 08500067 | 0.569562 | 0.0205880 | 252.820 | 08500066 | 0.00000 | 0.590150 | 242.566 |
| 4 | 08500068 | 0.581958 | 0.00819200 | 241.348 | 08500070 | 0.111994 | 0.478156 | 235.201 |