| Red | Green | Blue | |
| z | 17.64 | ||
| znorm | Inf | ||
| sky | -Inf | -NaN | -Inf |
| S/N | 23.9 | 38.5 | 43.9 |
| S/N(c) | 0.0 | 0.0 | 0.0 |
| SN(E/C) |
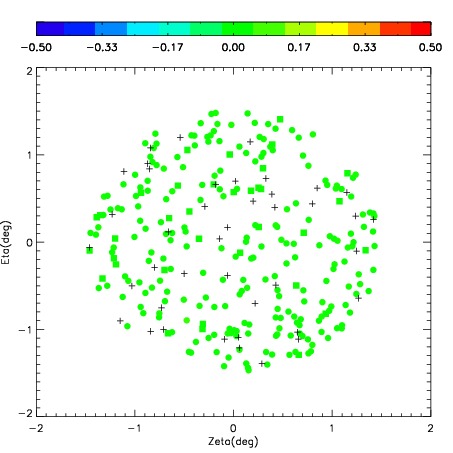
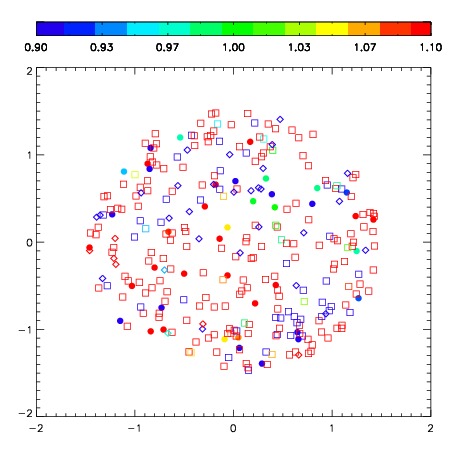
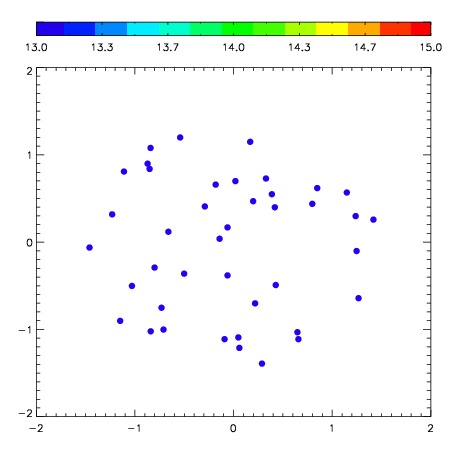
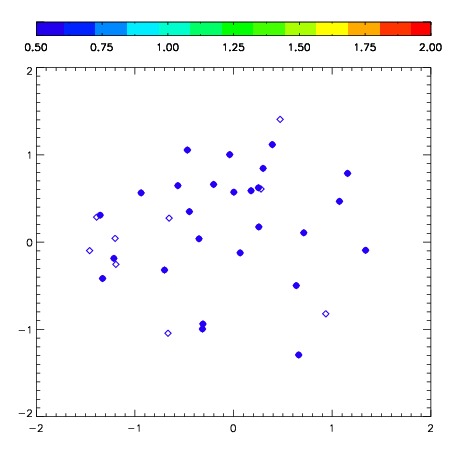
| Frame | Nreads | Zeropoints | Mag plots | Spatial mag deviation | Spatial sky 16325A emission deviations (filled: sky, open: star) | Spatial sky continuum emission | Spatial sky telluric CO2 absorption deviations (filled: H < 10) | |||||||||||||||||||||||
| 0 | 0 |
|
|
|
|
|
|
| IPAIR | NAME | SHIFT | NEWSHIFT | S/N | NAME | SHIFT | NEWSHIFT | S/N |
| 0 | 08810027 | 0.465896 | 0.00000 | 261.028 | 08810029 | 0.0387333 | 0.427163 | 266.505 |
| 1 | 08810032 | 0.461295 | 0.00460100 | 282.042 | 08810033 | 0.0384182 | 0.427478 | 281.306 |
| 2 | 08810031 | 0.464631 | 0.00126502 | 273.965 | 08810030 | 0.0399864 | 0.425910 | 273.298 |
| 3 | 08810028 | 0.462935 | 0.00296101 | 258.968 | 08810026 | 0.00000 | 0.465896 | 244.703 |