| Red | Green | Blue | |
| z | 17.64 | ||
| znorm | Inf | ||
| sky | -Inf | -Inf | -Inf |
| S/N | 28.4 | 47.0 | 49.0 |
| S/N(c) | 0.0 | 0.0 | 0.0 |
| SN(E/C) |

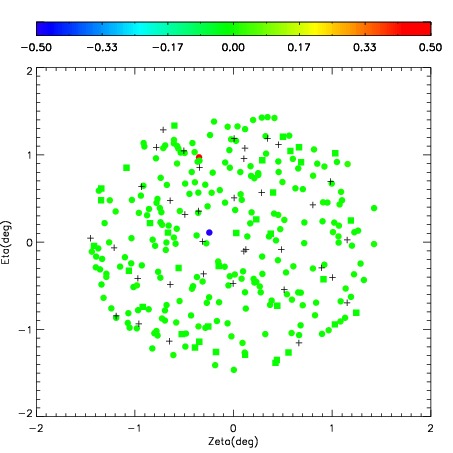
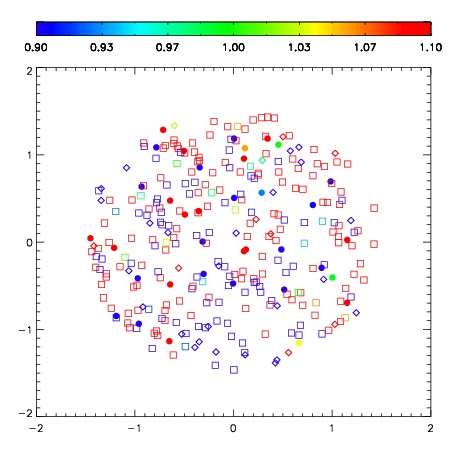


| Frame | Nreads | Zeropoints | Mag plots | Spatial mag deviation | Spatial sky 16325A emission deviations (filled: sky, open: star) | Spatial sky continuum emission | Spatial sky telluric CO2 absorption deviations (filled: H < 10) | |||||||||||||||||||||||
| 0 | 0 |
|
|
|
|
|
|
| IPAIR | NAME | SHIFT | NEWSHIFT | S/N | NAME | SHIFT | NEWSHIFT | S/N |
| 0 | 09810017 | 0.624150 | 0.00000 | 174.165 | 09810018 | 0.0962740 | 0.527876 | 178.977 |
| 1 | 09810013 | 0.619957 | 0.00419301 | 191.458 | 09810014 | 0.0820156 | 0.542134 | 195.321 |
| 2 | 09810012 | 0.618390 | 0.00575995 | 190.525 | 09810011 | 0.00000 | 0.624150 | 192.788 |
| 3 | 09810016 | 0.618921 | 0.00522900 | 179.695 | 09810015 | 0.0813962 | 0.542754 | 191.255 |