| Red | Green | Blue | |
| z | 17.64 | ||
| znorm | Inf | ||
| sky | -Inf | -NaN | -Inf |
| S/N | 23.7 | 38.4 | 44.9 |
| S/N(c) | 0.0 | 0.0 | 0.0 |
| SN(E/C) |

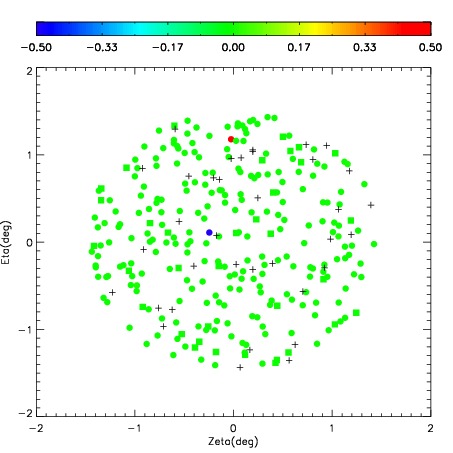
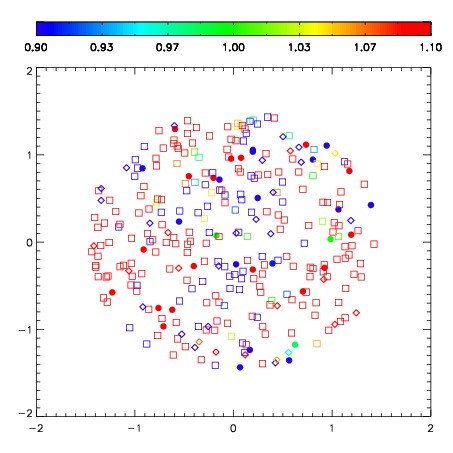


| Frame | Nreads | Zeropoints | Mag plots | Spatial mag deviation | Spatial sky 16325A emission deviations (filled: sky, open: star) | Spatial sky continuum emission | Spatial sky telluric CO2 absorption deviations (filled: H < 10) | |||||||||||||||||||||||
| 0 | 0 |
|
|
|
|
|
|
| IPAIR | NAME | SHIFT | NEWSHIFT | S/N | NAME | SHIFT | NEWSHIFT | S/N |
| 0 | 09820017 | 0.509197 | 0.00000 | 252.518 | 09820014 | 0.0273108 | 0.481886 | 254.488 |
| 1 | 09820013 | 0.498571 | 0.0106260 | 264.183 | 09820011 | 0.00000 | 0.509197 | 259.653 |
| 2 | 09820016 | 0.503300 | 0.00589699 | 260.881 | 09820015 | 0.0285021 | 0.480695 | 258.150 |
| 3 | 09820012 | 0.502367 | 0.00682998 | 256.879 | 09820018 | 0.0335160 | 0.475681 | 257.764 |