| Red | Green | Blue | |
| z | 17.64 | ||
| znorm | Inf | ||
| sky | -Inf | -Inf | -Inf |
| S/N | 26.2 | 45.8 | 52.6 |
| S/N(c) | 0.0 | 0.0 | 0.0 |
| SN(E/C) |

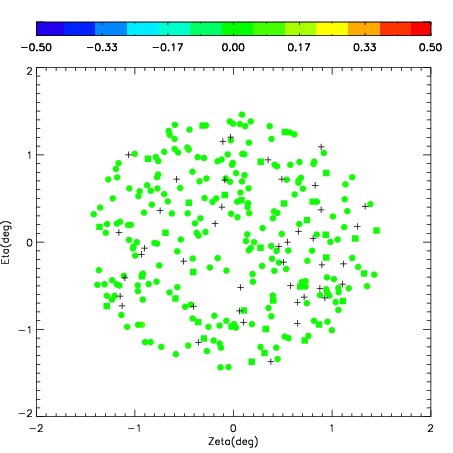
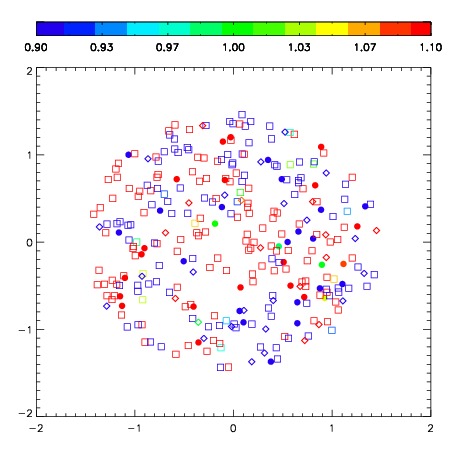
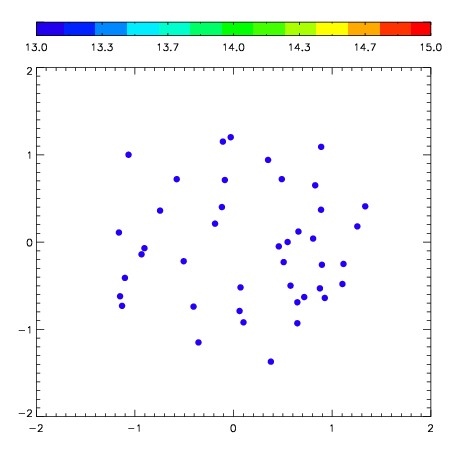

| Frame | Nreads | Zeropoints | Mag plots | Spatial mag deviation | Spatial sky 16325A emission deviations (filled: sky, open: star) | Spatial sky continuum emission | Spatial sky telluric CO2 absorption deviations (filled: H < 10) | |||||||||||||||||||||||
| 0 | 0 |
|
|
|
|
|
|
| IPAIR | NAME | SHIFT | NEWSHIFT | S/N | NAME | SHIFT | NEWSHIFT | S/N |
| 0 | 08750034 | 0.551194 | 0.00000 | 238.877 | 08750033 | 0.00000 | 0.551194 | 207.210 |
| 1 | 08750035 | 0.549186 | 0.00200802 | 258.231 | 08750037 | 0.0789001 | 0.472294 | 262.507 |
| 2 | 08750039 | 0.544784 | 0.00641000 | 256.459 | 08750036 | 0.0786536 | 0.472540 | 261.699 |
| 3 | 08750038 | 0.546420 | 0.00477403 | 255.324 | 08750040 | 0.0715744 | 0.479620 | 247.495 |
| 4 | 08750042 | 0.548473 | 0.00272101 | 251.819 | 08750041 | 0.0747719 | 0.476422 | 243.968 |