| Red | Green | Blue | |
| z | 17.64 | ||
| znorm | Inf | ||
| sky | -Inf | -Inf | -Inf |
| S/N | 28.0 | 46.5 | 52.1 |
| S/N(c) | 0.0 | 0.0 | 0.0 |
| SN(E/C) |


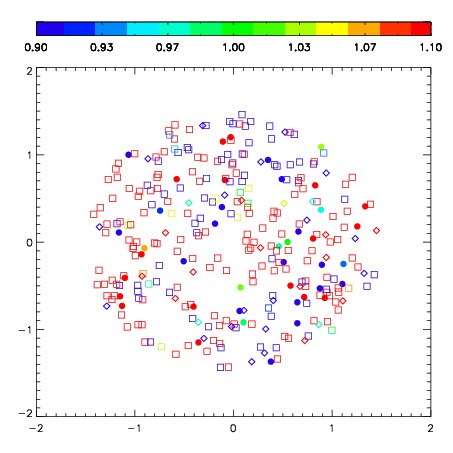
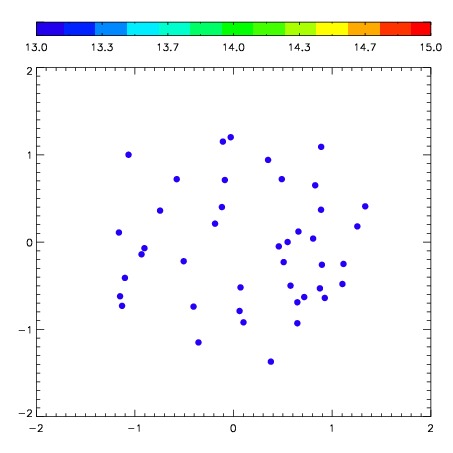
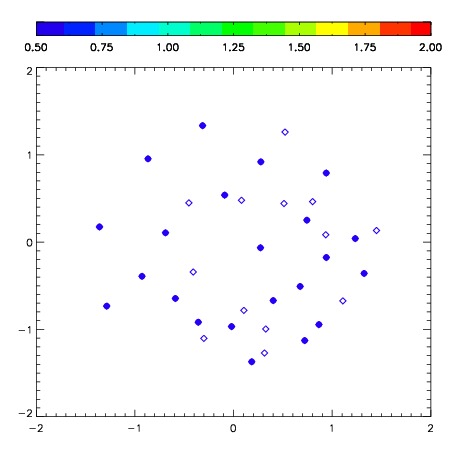
| Frame | Nreads | Zeropoints | Mag plots | Spatial mag deviation | Spatial sky 16325A emission deviations (filled: sky, open: star) | Spatial sky continuum emission | Spatial sky telluric CO2 absorption deviations (filled: H < 10) | |||||||||||||||||||||||
| 0 | 0 |
|
|
|
|
|
|
| IPAIR | NAME | SHIFT | NEWSHIFT | S/N | NAME | SHIFT | NEWSHIFT | S/N |
| 0 | 08820032 | 0.490471 | 0.00000 | 278.655 | 08820030 | 0.0274436 | 0.463027 | 274.638 |
| 1 | 08820028 | 0.489816 | 0.000654995 | 284.051 | 08820033 | 0.0277429 | 0.462728 | 279.858 |
| 2 | 08820027 | 0.489465 | 0.00100601 | 279.410 | 08820029 | 0.0265827 | 0.463888 | 279.799 |
| 3 | 08820031 | 0.488914 | 0.00155699 | 277.354 | 08820026 | 0.00000 | 0.490471 | 267.936 |