| Red | Green | Blue | |
| z | 17.64 | ||
| znorm | Inf | ||
| sky | -Inf | -NaN | -Inf |
| S/N | 21.7 | 36.4 | 37.9 |
| S/N(c) | 0.0 | 0.0 | 0.0 |
| SN(E/C) |

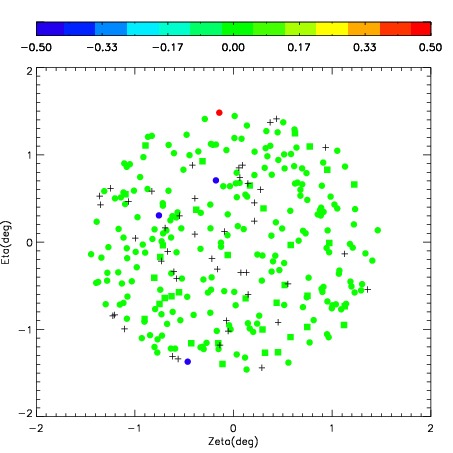

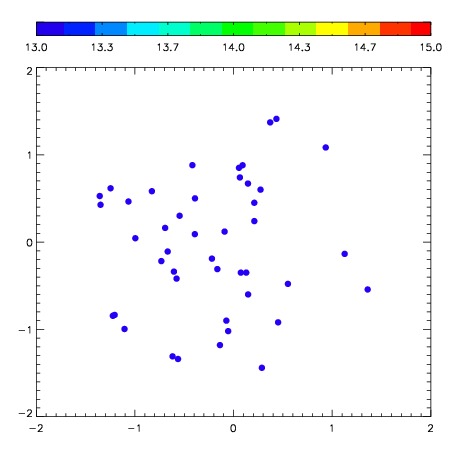
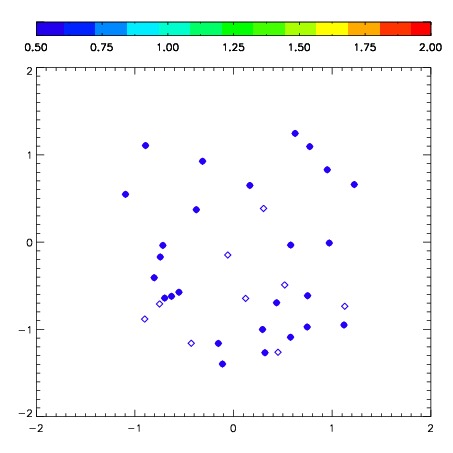
| Frame | Nreads | Zeropoints | Mag plots | Spatial mag deviation | Spatial sky 16325A emission deviations (filled: sky, open: star) | Spatial sky continuum emission | Spatial sky telluric CO2 absorption deviations (filled: H < 10) | |||||||||||||||||||||||
| 0 | 0 |
|
|
|
|
|
|
| IPAIR | NAME | SHIFT | NEWSHIFT | S/N | NAME | SHIFT | NEWSHIFT | S/N |
| 0 | 02600013 | 0.309889 | 0.00000 | 298.378 | 02600018 | -0.0153912 | 0.325280 | 294.865 |
| 1 | 02600016 | 0.306550 | 0.00333899 | 309.525 | 02600014 | -0.0103970 | 0.320286 | 299.919 |
| 2 | 02600012 | 0.309747 | 0.000141978 | 297.140 | 02600011 | 0.00000 | 0.309889 | 294.570 |
| 3 | 02600017 | 0.294297 | 0.0155920 | 0.00000 | 02600015 | -0.0127893 | 0.322678 | 244.185 |