| Red | Green | Blue | |
| z | 17.64 | ||
| znorm | Inf | ||
| sky | -Inf | -Inf | -Inf |
| S/N | 22.1 | 40.2 | 42.3 |
| S/N(c) | 0.0 | 0.0 | 0.0 |
| SN(E/C) |


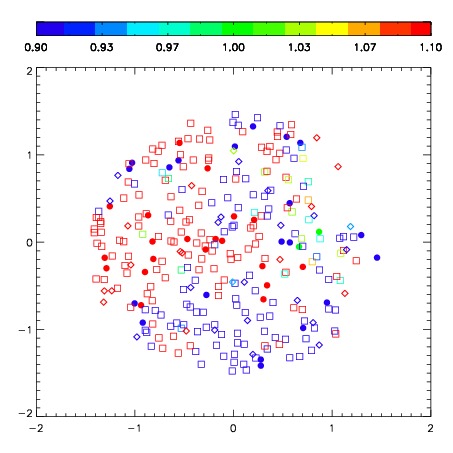


| Frame | Nreads | Zeropoints | Mag plots | Spatial mag deviation | Spatial sky 16325A emission deviations (filled: sky, open: star) | Spatial sky continuum emission | Spatial sky telluric CO2 absorption deviations (filled: H < 10) | |||||||||||||||||||||||
| 0 | 0 |
|
|
|
|
|
|
| IPAIR | NAME | SHIFT | NEWSHIFT | S/N | NAME | SHIFT | NEWSHIFT | S/N |
| 0 | 05450027 | 0.550984 | 0.00000 | 173.882 | 05450026 | 0.0563724 | 0.494612 | 168.556 |
| 1 | 05450024 | 0.546721 | 0.00426304 | 187.169 | 05450025 | 0.0527109 | 0.498273 | 186.999 |
| 2 | 05450028 | 0.547415 | 0.00356901 | 174.508 | 05450029 | 0.0519891 | 0.498995 | 177.217 |
| 3 | 05450023 | 0.544527 | 0.00645703 | 154.317 | 05450022 | 0.00000 | 0.550984 | 148.860 |