| Red | Green | Blue | |
| z | 17.64 | ||
| znorm | Inf | ||
| sky | -NaN | -NaN | -Inf |
| S/N | 31.0 | 52.5 | 54.0 |
| S/N(c) | 0.0 | 0.0 | 0.0 |
| SN(E/C) |
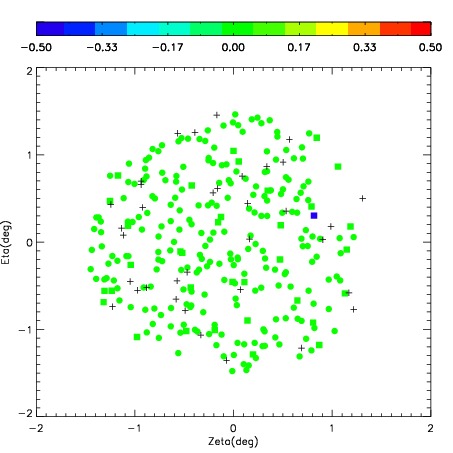
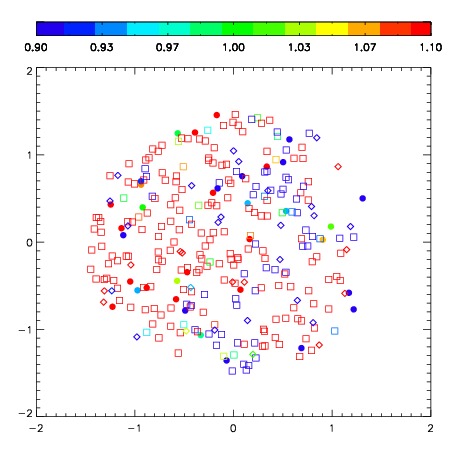
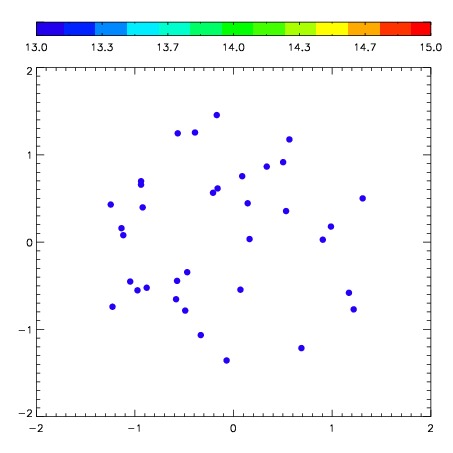
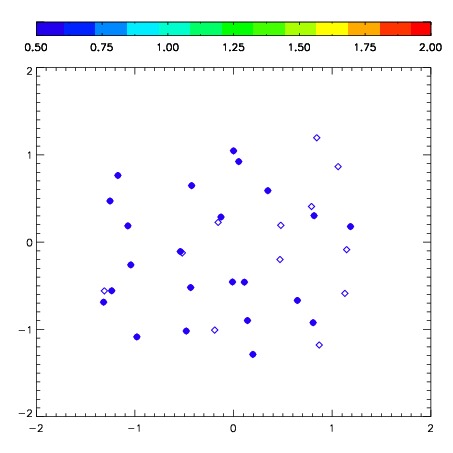
| Frame | Nreads | Zeropoints | Mag plots | Spatial mag deviation | Spatial sky 16325A emission deviations (filled: sky, open: star) | Spatial sky continuum emission | Spatial sky telluric CO2 absorption deviations (filled: H < 10) | |||||||||||||||||||||||
| 0 | 0 |
|
|
|
|
|
|
| IPAIR | NAME | SHIFT | NEWSHIFT | S/N | NAME | SHIFT | NEWSHIFT | S/N |
| 0 | 06340023 | 0.487070 | 0.00000 | 310.126 | 06340025 | 0.0335269 | 0.453543 | 311.452 |
| 1 | 06340024 | 0.486050 | 0.00101998 | 311.277 | 06340029 | 0.0281657 | 0.458904 | 312.075 |
| 2 | 06340028 | 0.481604 | 0.00546598 | 300.849 | 06340022 | 0.00000 | 0.487070 | 309.197 |
| 3 | 06340027 | 0.482114 | 0.00495601 | 292.185 | 06340026 | 0.0260608 | 0.461009 | 308.686 |