| Red | Green | Blue | |
| z | 17.64 | ||
| znorm | Inf | ||
| sky | -Inf | -Inf | -Inf |
| S/N | 24.1 | 42.0 | 44.9 |
| S/N(c) | 0.0 | 0.0 | 0.0 |
| SN(E/C) |

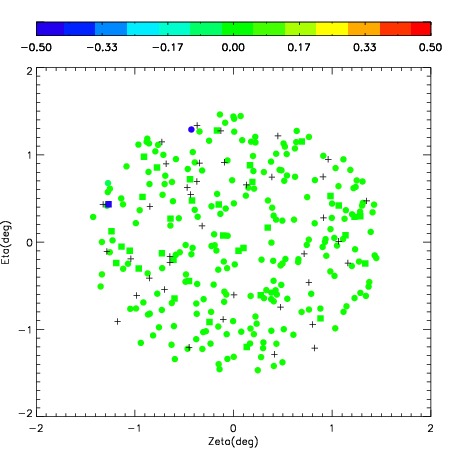
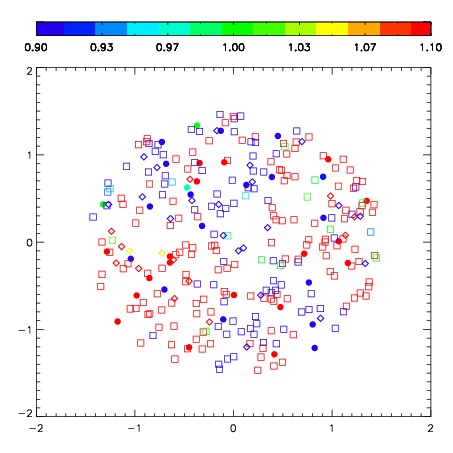


| Frame | Nreads | Zeropoints | Mag plots | Spatial mag deviation | Spatial sky 16325A emission deviations (filled: sky, open: star) | Spatial sky continuum emission | Spatial sky telluric CO2 absorption deviations (filled: H < 10) | |||||||||||||||||||||||
| 0 | 0 |
|
|
|
|
|
|
| IPAIR | NAME | SHIFT | NEWSHIFT | S/N | NAME | SHIFT | NEWSHIFT | S/N |
| 0 | 05480064 | 0.434862 | 0.00000 | 243.857 | 05480065 | 0.0249464 | 0.409916 | 243.229 |
| 1 | 05480063 | 0.433671 | 0.00119099 | 237.232 | 05480061 | 0.0265371 | 0.408325 | 240.025 |
| 2 | 05480060 | 0.425353 | 0.00950900 | 236.071 | 05480062 | 0.0276271 | 0.407235 | 233.433 |
| 3 | 05480059 | 0.430314 | 0.00454798 | 225.890 | 05480058 | 0.00000 | 0.434862 | 232.168 |