| Red | Green | Blue | |
| z | 17.64 | ||
| znorm | Inf | ||
| sky | -NaN | -Inf | -Inf |
| S/N | 27.4 | 45.2 | 46.5 |
| S/N(c) | 0.0 | 0.0 | 0.0 |
| SN(E/C) |


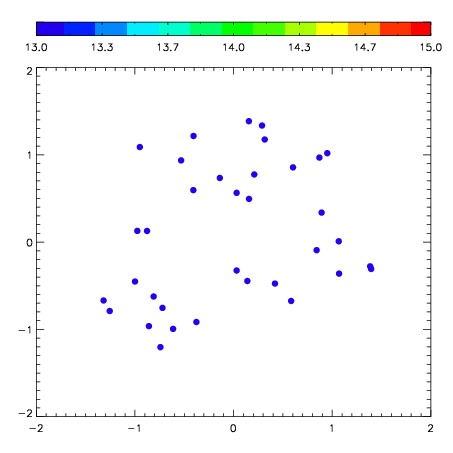

| Frame | Nreads | Zeropoints | Mag plots | Spatial mag deviation | Spatial sky 16325A emission deviations (filled: sky, open: star) | Spatial sky continuum emission | Spatial sky telluric CO2 absorption deviations (filled: H < 10) | |||||||||||||||||||||||
| 0 | 0 |
|
|
|
|
|
|
| IPAIR | NAME | SHIFT | NEWSHIFT | S/N | NAME | SHIFT | NEWSHIFT | S/N |
| 0 | 02830010 | 0.352862 | 0.00000 | 238.643 | 02830011 | 0.00637178 | 0.346490 | 240.863 |
| 1 | 02830009 | 0.351480 | 0.00138199 | 245.875 | 02830008 | 0.00000 | 0.352862 | 248.595 |
| 2 | 02830013 | 0.349726 | 0.00313601 | 244.652 | 02830015 | 0.00375374 | 0.349108 | 244.090 |
| 3 | 02830014 | 0.351428 | 0.00143400 | 243.593 | 02830012 | 0.00722845 | 0.345634 | 242.272 |