| Red | Green | Blue | |
| z | 17.64 | ||
| znorm | Inf | ||
| sky | -Inf | -Inf | -Inf |
| S/N | 28.6 | 49.5 | 54.8 |
| S/N(c) | 0.0 | 0.0 | 0.0 |
| SN(E/C) |
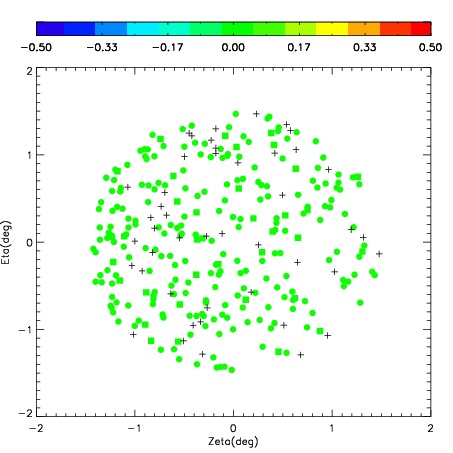
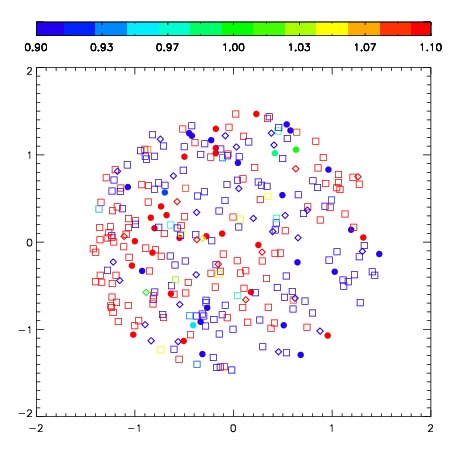
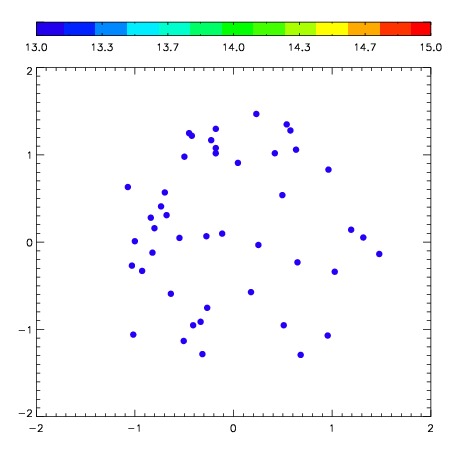
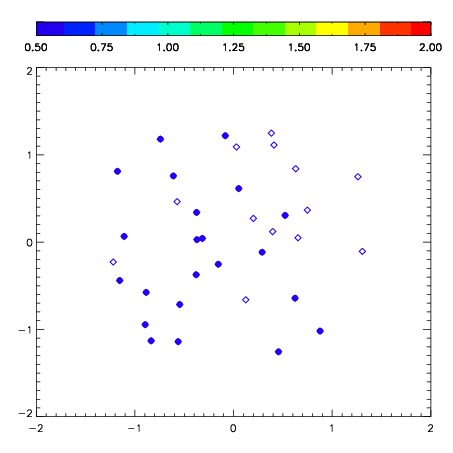
| Frame | Nreads | Zeropoints | Mag plots | Spatial mag deviation | Spatial sky 16325A emission deviations (filled: sky, open: star) | Spatial sky continuum emission | Spatial sky telluric CO2 absorption deviations (filled: H < 10) | |||||||||||||||||||||||
| 0 | 0 |
|
|
|
|
|
|
| IPAIR | NAME | SHIFT | NEWSHIFT | S/N | NAME | SHIFT | NEWSHIFT | S/N |
| 0 | 05230070 | 0.457064 | 0.00000 | 276.006 | 05230076 | 0.0173920 | 0.439672 | 285.917 |
| 1 | 05230075 | 0.448886 | 0.00817800 | 288.495 | 05230073 | 0.0189447 | 0.438119 | 293.692 |
| 2 | 05230071 | 0.448254 | 0.00881001 | 288.189 | 05230072 | 0.0184709 | 0.438593 | 292.892 |
| 3 | 05230074 | 0.450363 | 0.00670099 | 283.703 | 05230069 | 0.00000 | 0.457064 | 287.718 |