| Red | Green | Blue | |
| z | 17.64 | ||
| znorm | Inf | ||
| sky | -Inf | -Inf | -NaN |
| S/N | 20.4 | 36.6 | 39.0 |
| S/N(c) | 0.0 | 0.0 | 0.0 |
| SN(E/C) |

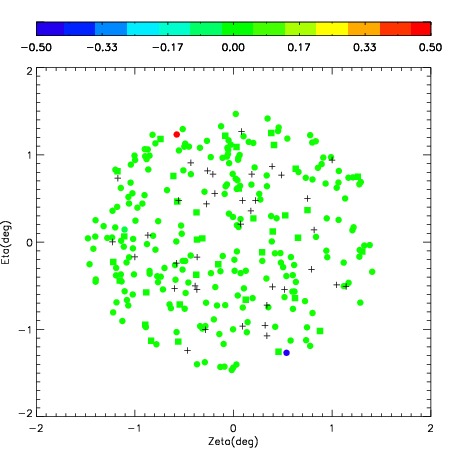
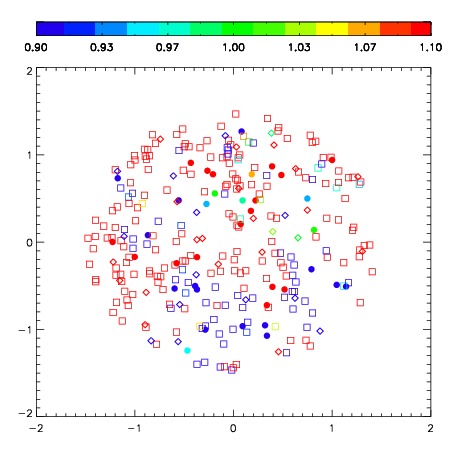


| Frame | Nreads | Zeropoints | Mag plots | Spatial mag deviation | Spatial sky 16325A emission deviations (filled: sky, open: star) | Spatial sky continuum emission | Spatial sky telluric CO2 absorption deviations (filled: H < 10) | |||||||||||||||||||||||
| 0 | 0 |
|
|
|
|
|
|
| IPAIR | NAME | SHIFT | NEWSHIFT | S/N | NAME | SHIFT | NEWSHIFT | S/N |
| 0 | 06640012 | 0.450939 | 0.00000 | 171.236 | 06640013 | 0.0103990 | 0.440540 | 196.368 |
| 1 | 06640016 | 0.437036 | 0.0139030 | 283.774 | 06640017 | 0.0103285 | 0.440610 | 271.000 |
| 2 | 06640015 | 0.442017 | 0.00892201 | 243.533 | 06640014 | 0.00658786 | 0.444351 | 233.440 |
| 3 | 06640011 | 0.443821 | 0.00711799 | 181.260 | 06640010 | 0.00000 | 0.450939 | 199.139 |