| Red | Green | Blue | |
| z | 17.64 | ||
| znorm | Inf | ||
| sky | -Inf | -NaN | -Inf |
| S/N | 26.9 | 45.9 | 52.2 |
| S/N(c) | 0.0 | 0.0 | 0.0 |
| SN(E/C) |

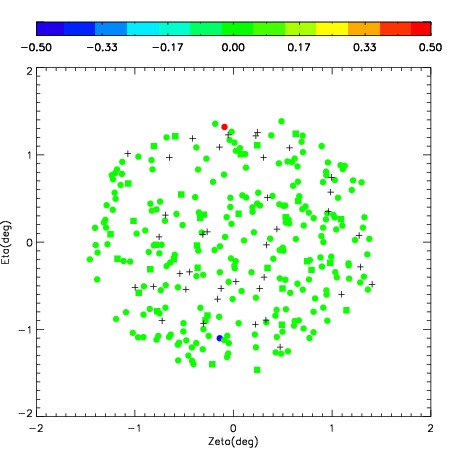
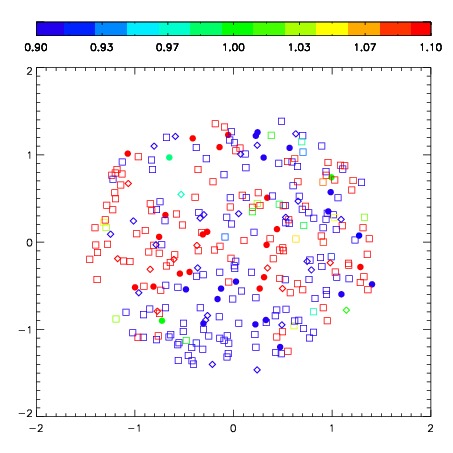
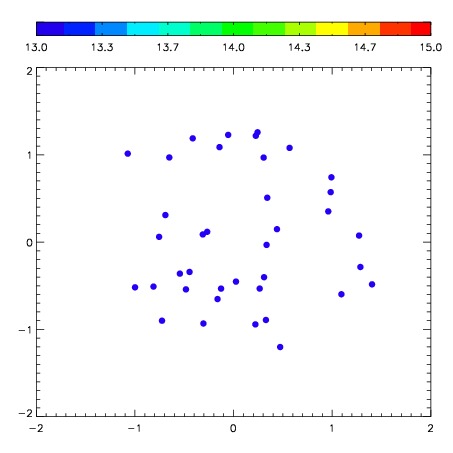

| Frame | Nreads | Zeropoints | Mag plots | Spatial mag deviation | Spatial sky 16325A emission deviations (filled: sky, open: star) | Spatial sky continuum emission | Spatial sky telluric CO2 absorption deviations (filled: H < 10) | |||||||||||||||||||||||
| 0 | 0 |
|
|
|
|
|
|
| IPAIR | NAME | SHIFT | NEWSHIFT | S/N | NAME | SHIFT | NEWSHIFT | S/N |
| 0 | 05220069 | 0.404491 | 0.00000 | 280.676 | 05220070 | -0.00913942 | 0.413630 | 281.315 |
| 1 | 05220068 | 0.400713 | 0.00377801 | 277.259 | 05220067 | -0.00813948 | 0.412630 | 278.087 |
| 2 | 05220064 | 0.391844 | 0.0126470 | 271.837 | 05220063 | 0.00000 | 0.404491 | 275.795 |
| 3 | 05220065 | 0.400621 | 0.00387001 | 269.808 | 05220066 | -0.00552428 | 0.410015 | 275.603 |