| Red | Green | Blue | |
| z | 17.64 | ||
| znorm | Inf | ||
| sky | -Inf | -Inf | -Inf |
| S/N | 24.3 | 42.3 | 46.9 |
| S/N(c) | 0.0 | 0.0 | 0.0 |
| SN(E/C) |
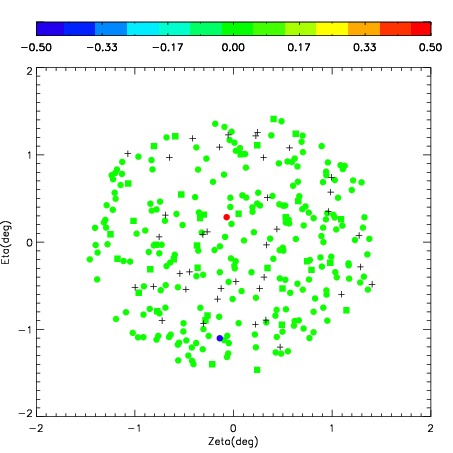
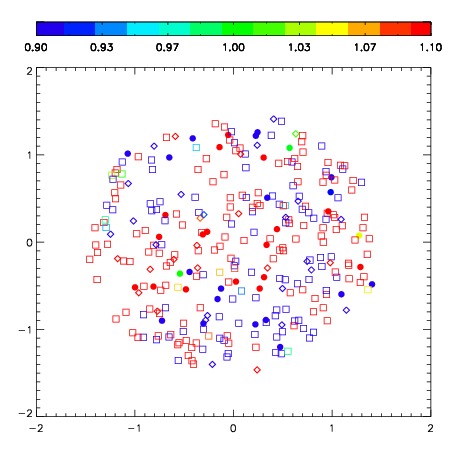
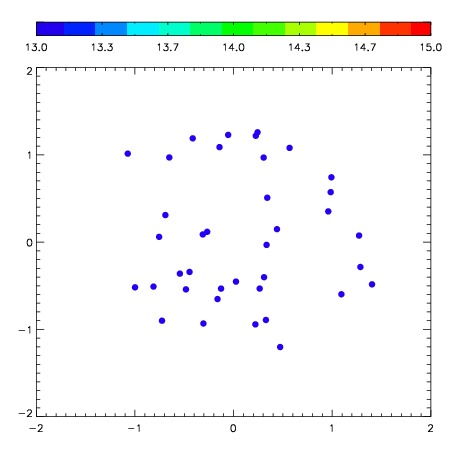
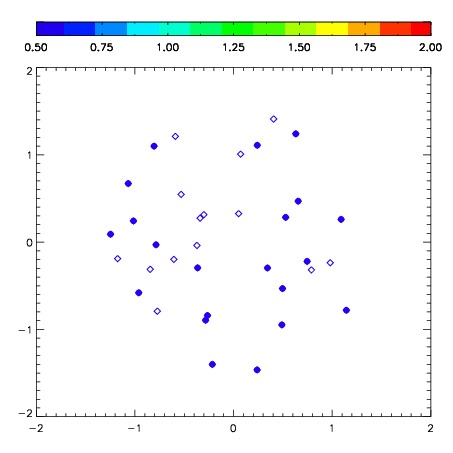
| Frame | Nreads | Zeropoints | Mag plots | Spatial mag deviation | Spatial sky 16325A emission deviations (filled: sky, open: star) | Spatial sky continuum emission | Spatial sky telluric CO2 absorption deviations (filled: H < 10) | |||||||||||||||||||||||
| 0 | 0 |
|
|
|
|
|
|
| IPAIR | NAME | SHIFT | NEWSHIFT | S/N | NAME | SHIFT | NEWSHIFT | S/N |
| 0 | 05260044 | 0.439991 | 0.00000 | 275.748 | 05260046 | 0.0203702 | 0.419621 | 266.374 |
| 1 | 05260041 | 0.432778 | 0.00721300 | 279.025 | 05260039 | 0.00000 | 0.439991 | 276.530 |
| 2 | 05260040 | 0.437258 | 0.00273299 | 276.268 | 05260042 | 0.0214814 | 0.418510 | 274.960 |
| 3 | 05260045 | 0.436182 | 0.00380901 | 268.870 | 05260043 | 0.0226950 | 0.417296 | 265.995 |