| Red | Green | Blue | |
| z | 17.64 | ||
| znorm | Inf | ||
| sky | -Inf | -Inf | -Inf |
| S/N | 29.4 | 46.5 | 50.0 |
| S/N(c) | 0.0 | 0.0 | 0.0 |
| SN(E/C) |

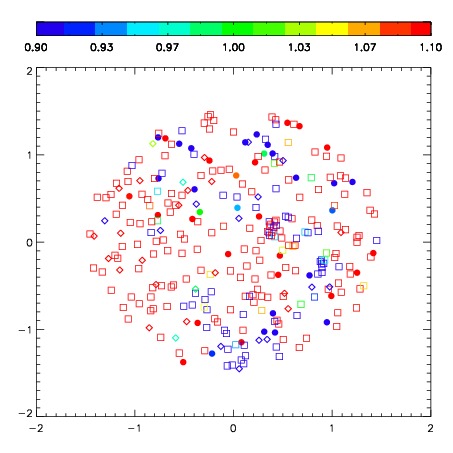
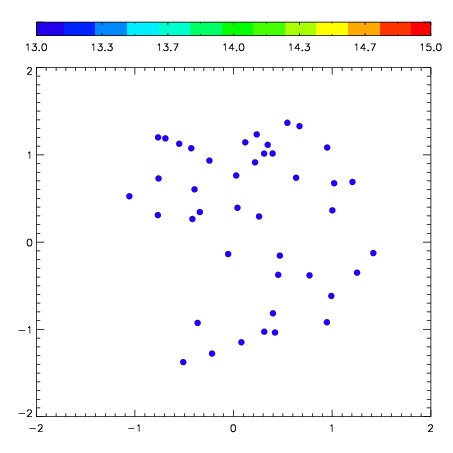
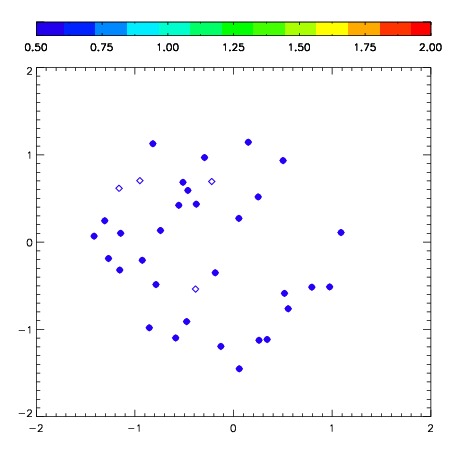
| Frame | Nreads | Zeropoints | Mag plots | Spatial mag deviation | Spatial sky 16325A emission deviations (filled: sky, open: star) | Spatial sky continuum emission | Spatial sky telluric CO2 absorption deviations (filled: H < 10) | |||||||||||||||||||||||
| 0 | 0 |
|
|
|
|
|
|
| IPAIR | NAME | SHIFT | NEWSHIFT | S/N | NAME | SHIFT | NEWSHIFT | S/N |
| 0 | 06430012 | 0.509574 | 0.00000 | 276.614 | 06430017 | 0.0465962 | 0.462978 | 274.959 |
| 1 | 06430015 | 0.503969 | 0.00560498 | 279.200 | 06430010 | 0.00000 | 0.509574 | 281.130 |
| 2 | 06430011 | 0.506326 | 0.00324798 | 278.625 | 06430014 | 0.0439988 | 0.465575 | 279.998 |
| 3 | 06430016 | 0.504722 | 0.00485200 | 274.097 | 06430013 | 0.0448728 | 0.464701 | 268.323 |