| Red | Green | Blue | |
| z | 17.63 | ||
| znorm | Inf | ||
| sky | -NaN | -NaN | -Inf |
| S/N | 17.6 | 31.0 | 32.4 |
| S/N(c) | 0.0 | 0.0 | 0.0 |
| SN(E/C) |


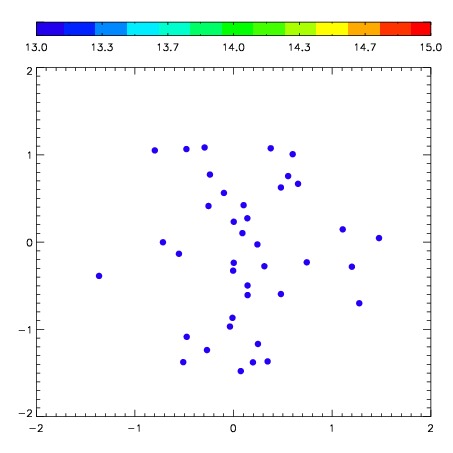
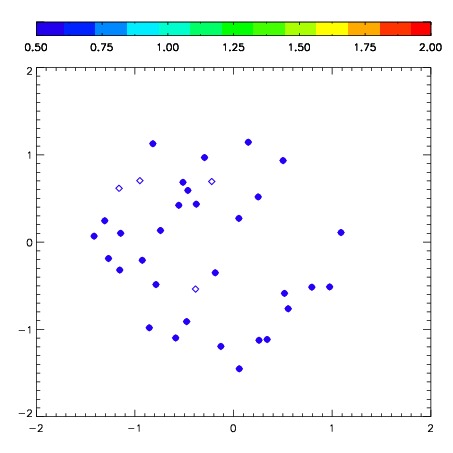
| Frame | Nreads | Zeropoints | Mag plots | Spatial mag deviation | Spatial sky 16325A emission deviations (filled: sky, open: star) | Spatial sky continuum emission | Spatial sky telluric CO2 absorption deviations (filled: H < 10) | |||||||||||||||||||||||
| 0 | 0 |
|
|
|
|
|
|
| IPAIR | NAME | SHIFT | NEWSHIFT | S/N | NAME | SHIFT | NEWSHIFT | S/N |
| 0 | 06650032 | 0.509432 | 0.00000 | 151.001 | 06650033 | 0.0411941 | 0.468238 | 160.876 |
| 1 | 06650027 | 0.499412 | 0.0100200 | 198.820 | 06650026 | 0.00000 | 0.509432 | 210.714 |
| 2 | 06650028 | 0.498213 | 0.0112190 | 193.864 | 06650029 | 0.0467285 | 0.462704 | 182.269 |
| 3 | 06650031 | 0.502239 | 0.00719303 | 186.333 | 06650030 | 0.0492553 | 0.460177 | 178.624 |