| Red | Green | Blue | |
| z | 17.64 | ||
| znorm | Inf | ||
| sky | -NaN | -Inf | -Inf |
| S/N | 16.6 | 30.8 | 31.9 |
| S/N(c) | 0.0 | 0.0 | 0.0 |
| SN(E/C) |

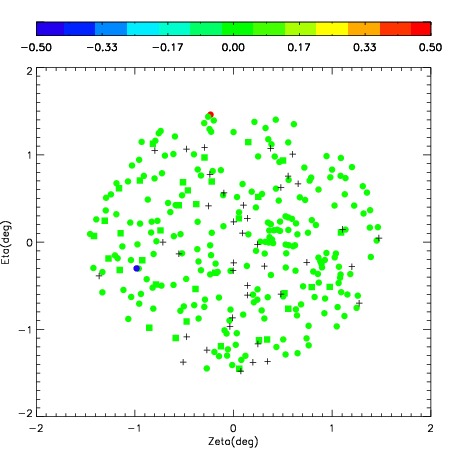
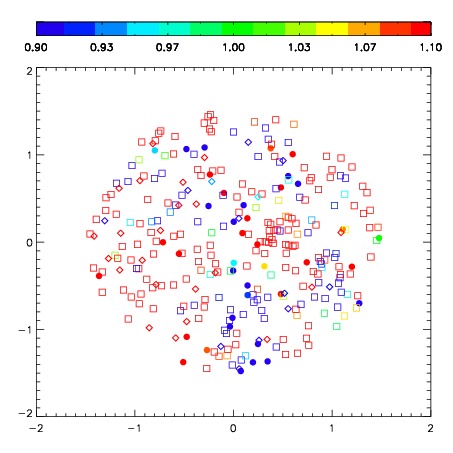

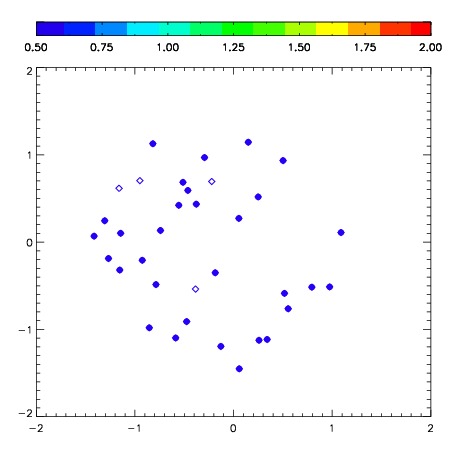
| Frame | Nreads | Zeropoints | Mag plots | Spatial mag deviation | Spatial sky 16325A emission deviations (filled: sky, open: star) | Spatial sky continuum emission | Spatial sky telluric CO2 absorption deviations (filled: H < 10) | |||||||||||||||||||||||
| 0 | 0 |
|
|
|
|
|
|
| IPAIR | NAME | SHIFT | NEWSHIFT | S/N | NAME | SHIFT | NEWSHIFT | S/N |
| 0 | 06890017 | 0.606719 | 0.00000 | 204.607 | 06890015 | 0.0928073 | 0.513912 | 197.804 |
| 1 | 06890013 | 0.601186 | 0.00553304 | 241.358 | 06890018 | 0.0955632 | 0.511156 | 206.990 |
| 2 | 06890016 | 0.606379 | 0.000340044 | 214.386 | 06890014 | 0.0947332 | 0.511986 | 200.119 |
| 3 | 06890012 | 0.596153 | 0.0105660 | 0.00000 | 06890011 | 0.00000 | 0.606719 | 178.043 |