| Red | Green | Blue | |
| z | 17.64 | ||
| znorm | Inf | ||
| sky | -Inf | -Inf | -Inf |
| S/N | 22.4 | 38.9 | 42.4 |
| S/N(c) | 0.0 | 0.0 | 0.0 |
| SN(E/C) |

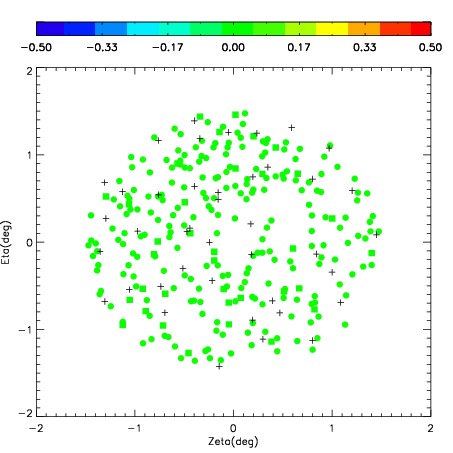
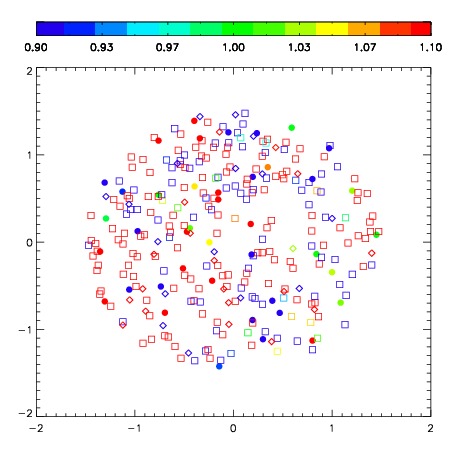
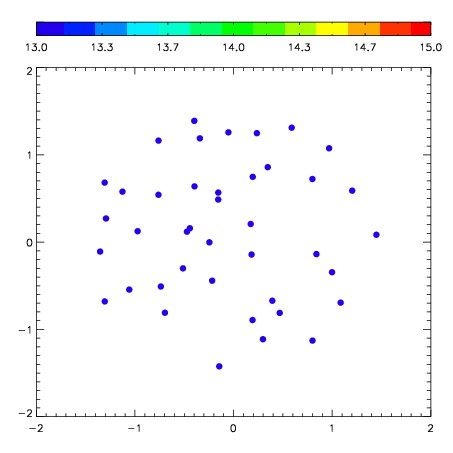
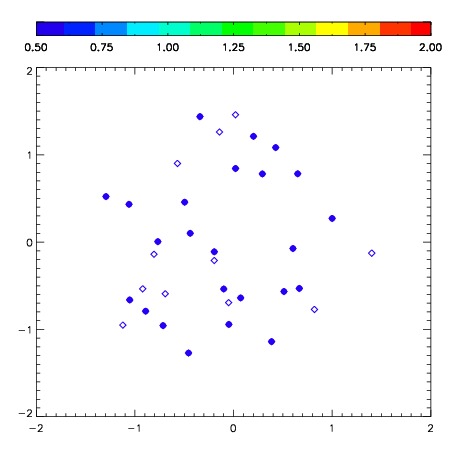
| Frame | Nreads | Zeropoints | Mag plots | Spatial mag deviation | Spatial sky 16325A emission deviations (filled: sky, open: star) | Spatial sky continuum emission | Spatial sky telluric CO2 absorption deviations (filled: H < 10) | |||||||||||||||||||||||
| 0 | 0 |
|
|
|
|
|
|
| IPAIR | NAME | SHIFT | NEWSHIFT | S/N | NAME | SHIFT | NEWSHIFT | S/N |
| 0 | 06080053 | 0.435883 | 0.00000 | 174.041 | 06080054 | -0.00272390 | 0.438607 | 166.216 |
| 1 | 06080048 | 0.432693 | 0.00318998 | 184.982 | 06080051 | -0.00337411 | 0.439257 | 185.516 |
| 2 | 06080052 | 0.431656 | 0.00422698 | 183.573 | 06080050 | 0.000722751 | 0.435160 | 178.959 |
| 3 | 06080049 | 0.430543 | 0.00533998 | 180.548 | 06080047 | 0.00000 | 0.435883 | 175.544 |