| Red | Green | Blue | |
| z | 17.64 | ||
| znorm | Inf | ||
| sky | -NaN | -Inf | -Inf |
| S/N | 30.2 | 52.7 | 58.1 |
| S/N(c) | 0.0 | 0.0 | 0.0 |
| SN(E/C) |


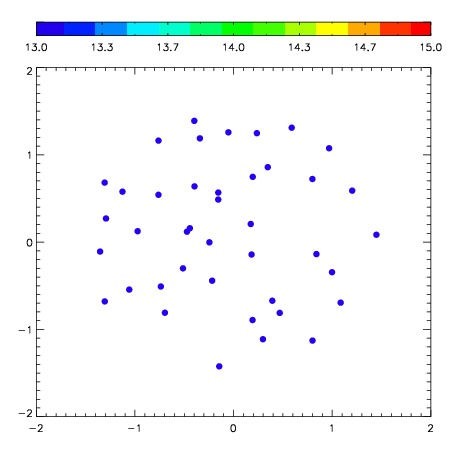
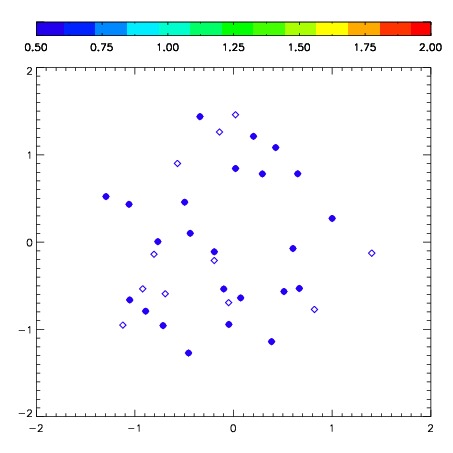
| Frame | Nreads | Zeropoints | Mag plots | Spatial mag deviation | Spatial sky 16325A emission deviations (filled: sky, open: star) | Spatial sky continuum emission | Spatial sky telluric CO2 absorption deviations (filled: H < 10) | |||||||||||||||||||||||
| 0 | 0 |
|
|
|
|
|
|
| IPAIR | NAME | SHIFT | NEWSHIFT | S/N | NAME | SHIFT | NEWSHIFT | S/N |
| 0 | 06310047 | 0.409595 | 0.00000 | 198.562 | 06310045 | -0.0169131 | 0.426508 | 192.205 |
| 1 | 06310038 | 0.390677 | 0.0189180 | 221.796 | 06310037 | 0.00000 | 0.409595 | 216.743 |
| 2 | 06310039 | 0.391385 | 0.0182100 | 217.238 | 06310041 | -0.0131300 | 0.422725 | 213.120 |
| 3 | 06310042 | 0.395284 | 0.0143110 | 210.447 | 06310040 | -0.0124085 | 0.422004 | 210.151 |
| 4 | 06310043 | 0.403814 | 0.00578102 | 207.502 | 06310044 | -0.0142787 | 0.423874 | 202.439 |
| 5 | 06310046 | 0.406604 | 0.00299102 | 199.106 | 06310048 | -0.0135487 | 0.423144 | 198.393 |