| Red | Green | Blue | |
| z | 17.64 | ||
| znorm | Inf | ||
| sky | -Inf | -NaN | -Inf |
| S/N | 20.3 | 35.3 | 40.7 |
| S/N(c) | 0.0 | 0.0 | 0.0 |
| SN(E/C) |

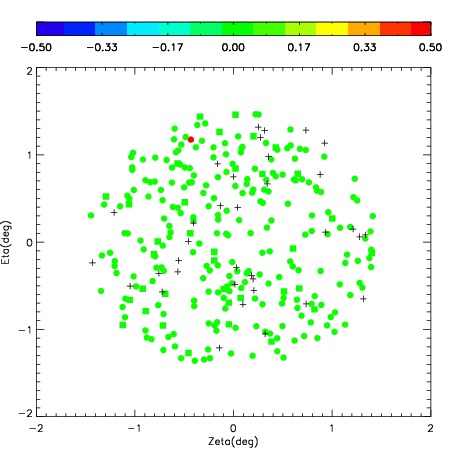
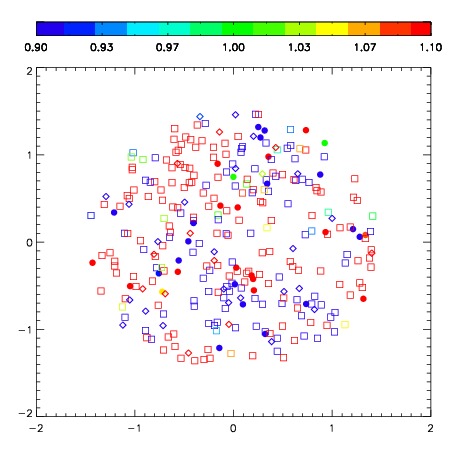
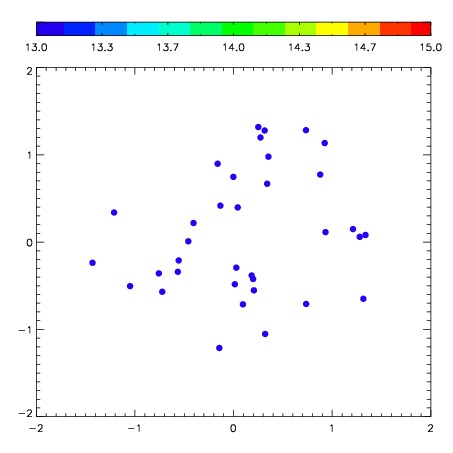
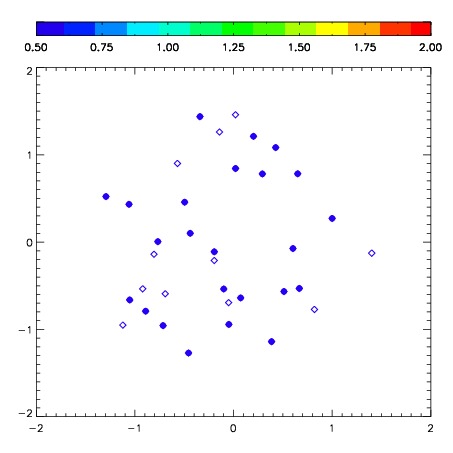
| Frame | Nreads | Zeropoints | Mag plots | Spatial mag deviation | Spatial sky 16325A emission deviations (filled: sky, open: star) | Spatial sky continuum emission | Spatial sky telluric CO2 absorption deviations (filled: H < 10) | |||||||||||||||||||||||
| 0 | 0 |
|
|
|
|
|
|
| IPAIR | NAME | SHIFT | NEWSHIFT | S/N | NAME | SHIFT | NEWSHIFT | S/N |
| 0 | 06420034 | 0.538796 | 0.00000 | 217.633 | 06420036 | 0.0833821 | 0.455414 | 213.172 |
| 1 | 06420039 | 0.523331 | 0.0154650 | 240.733 | 06420037 | 0.0787846 | 0.460011 | 220.069 |
| 2 | 06420038 | 0.528798 | 0.00999802 | 234.694 | 06420033 | 0.00000 | 0.538796 | 219.510 |
| 3 | 06420035 | 0.536593 | 0.00220299 | 221.541 | 06420040 | 0.0741305 | 0.464666 | 216.853 |