| Red | Green | Blue | |
| z | 17.64 | ||
| znorm | Inf | ||
| sky | -NaN | -NaN | -Inf |
| S/N | 18.0 | 32.1 | 35.5 |
| S/N(c) | 0.0 | 0.0 | 0.0 |
| SN(E/C) |

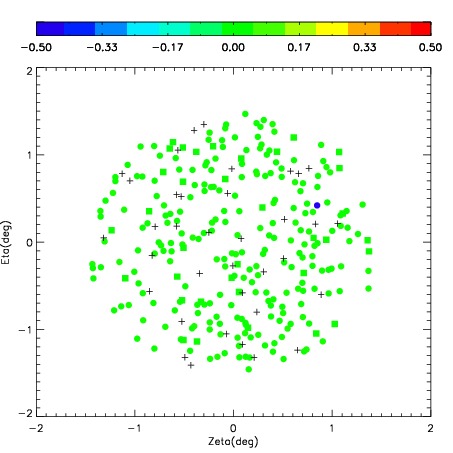
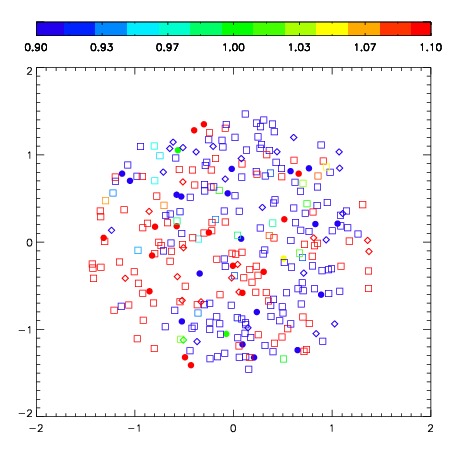


| Frame | Nreads | Zeropoints | Mag plots | Spatial mag deviation | Spatial sky 16325A emission deviations (filled: sky, open: star) | Spatial sky continuum emission | Spatial sky telluric CO2 absorption deviations (filled: H < 10) | |||||||||||||||||||||||
| 0 | 0 |
|
|
|
|
|
|
| IPAIR | NAME | SHIFT | NEWSHIFT | S/N | NAME | SHIFT | NEWSHIFT | S/N |
| 0 | 05490061 | 0.354903 | 0.00000 | 104.157 | 05490066 | -0.0489497 | 0.403853 | 132.854 |
| 1 | 05490060 | 0.287906 | 0.0669970 | 289.778 | 05490059 | 0.00000 | 0.354903 | 290.419 |
| 2 | 05490068 | 0.295565 | 0.0593380 | 288.960 | 05490070 | -0.0544162 | 0.409319 | 284.122 |
| 3 | 05490069 | 0.327378 | 0.0275250 | 224.981 | 05490067 | -0.0533091 | 0.408212 | 282.363 |