| Red | Green | Blue | |
| z | 17.63 | ||
| znorm | Inf | ||
| sky | -NaN | -NaN | -Inf |
| S/N | 21.2 | 36.4 | 38.7 |
| S/N(c) | 0.0 | 0.0 | 0.0 |
| SN(E/C) |

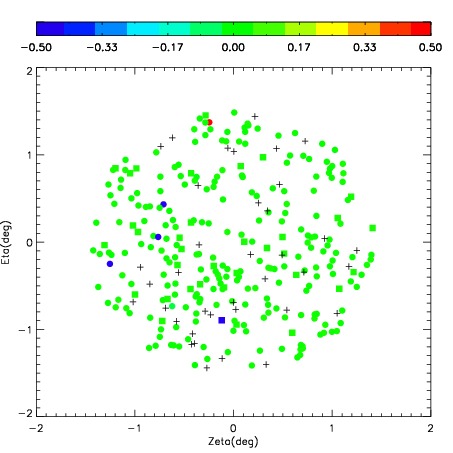
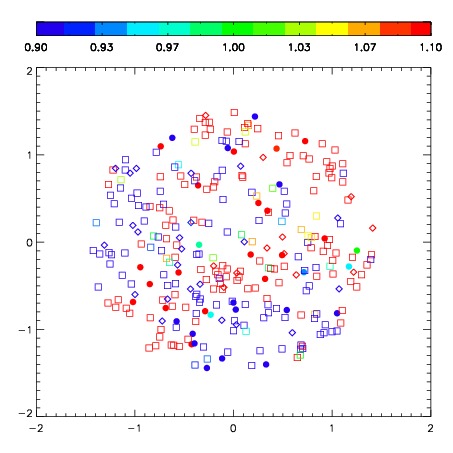

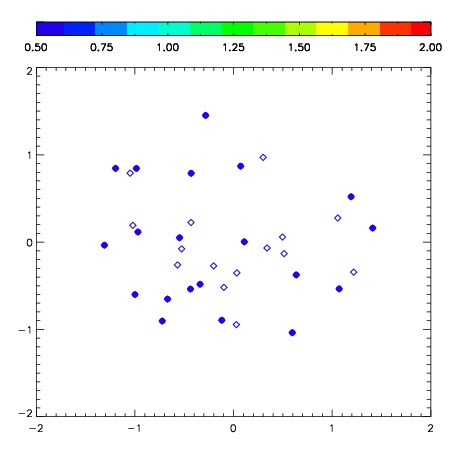
| Frame | Nreads | Zeropoints | Mag plots | Spatial mag deviation | Spatial sky 16325A emission deviations (filled: sky, open: star) | Spatial sky continuum emission | Spatial sky telluric CO2 absorption deviations (filled: H < 10) | |||||||||||||||||||||||
| 0 | 0 |
|
|
|
|
|
|
| IPAIR | NAME | SHIFT | NEWSHIFT | S/N | NAME | SHIFT | NEWSHIFT | S/N |
| 0 | 02830041 | 0.404057 | 0.00000 | 238.182 | 02830039 | 0.0196931 | 0.384364 | 234.802 |
| 1 | 02830037 | 0.402551 | 0.00150600 | 238.705 | 02830038 | 0.0242467 | 0.379810 | 237.420 |
| 2 | 02830040 | 0.403711 | 0.000346005 | 236.753 | 02830042 | 0.0257876 | 0.378269 | 233.114 |
| 3 | 02830036 | 0.400239 | 0.00381801 | 224.253 | 02830035 | 0.00000 | 0.404057 | 224.410 |