| Red | Green | Blue | |
| z | 17.63 | ||
| znorm | Inf | ||
| sky | -NaN | -NaN | -Inf |
| S/N | 24.0 | 40.2 | 45.6 |
| S/N(c) | 0.0 | 0.0 | 0.0 |
| SN(E/C) |

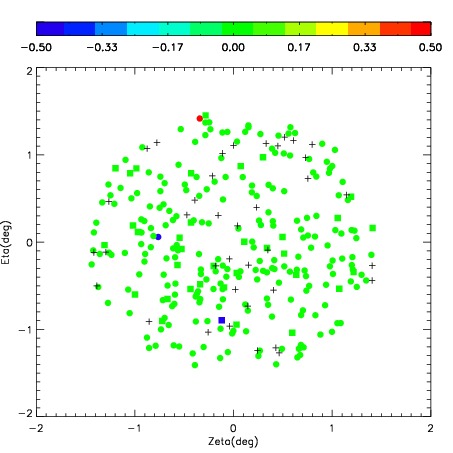


| Frame | Nreads | Zeropoints | Mag plots | Spatial mag deviation | Spatial sky 16325A emission deviations (filled: sky, open: star) | Spatial sky continuum emission | Spatial sky telluric CO2 absorption deviations (filled: H < 10) | |||||||||||||||||||||||
| 0 | 0 |
|
|
|
|
|
|
| IPAIR | NAME | SHIFT | NEWSHIFT | S/N | NAME | SHIFT | NEWSHIFT | S/N |
| 0 | 02610041 | 0.383086 | 0.00000 | 300.859 | 02610039 | 0.00000 | 0.383086 | 294.905 |
| 1 | 02610044 | 0.380252 | 0.00283399 | 297.112 | 02610043 | 0.0250408 | 0.358045 | 284.689 |
| 2 | 02610040 | 0.376290 | 0.00679600 | 295.382 | 02610042 | 0.0321184 | 0.350968 | 274.398 |
| 3 | 02610045 | 0.381141 | 0.00194499 | 294.814 | 02610046 | 0.0261380 | 0.356948 | 267.514 |