| Red | Green | Blue | |
| z | 17.64 | ||
| znorm | Inf | ||
| sky | -NaN | -Inf | -Inf |
| S/N | 25.2 | 42.3 | 45.3 |
| S/N(c) | 0.0 | 0.0 | 0.0 |
| SN(E/C) |

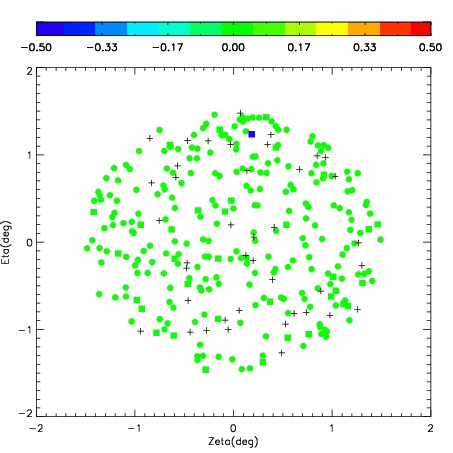
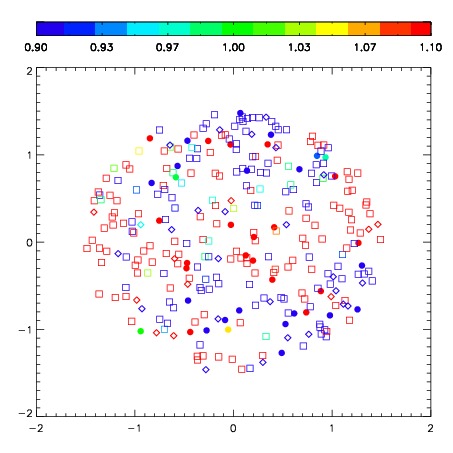

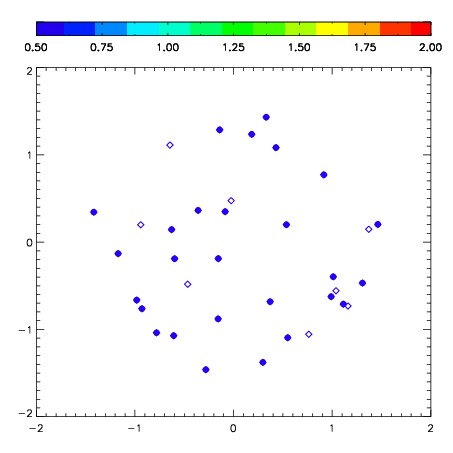
| Frame | Nreads | Zeropoints | Mag plots | Spatial mag deviation | Spatial sky 16325A emission deviations (filled: sky, open: star) | Spatial sky continuum emission | Spatial sky telluric CO2 absorption deviations (filled: H < 10) | |||||||||||||||||||||||
| 0 | 0 |
|
|
|
|
|
|
| IPAIR | NAME | SHIFT | NEWSHIFT | S/N | NAME | SHIFT | NEWSHIFT | S/N |
| 0 | 03190016 | 0.484698 | 0.00000 | 231.381 | 03190017 | -0.00278020 | 0.487478 | 226.431 |
| 1 | 03190012 | 0.476080 | 0.00861800 | 250.784 | 03190013 | -0.00712892 | 0.491827 | 247.137 |
| 2 | 03190011 | 0.468995 | 0.0157030 | 247.290 | 03190014 | -0.00521520 | 0.489913 | 246.520 |
| 3 | 03190015 | 0.482515 | 0.00218299 | 243.556 | 03190010 | 0.00000 | 0.484698 | 244.182 |