| Red | Green | Blue | |
| z | 17.64 | ||
| znorm | Inf | ||
| sky | -NaN | -Inf | -Inf |
| S/N | 28.6 | 45.1 | 51.4 |
| S/N(c) | 0.0 | 0.0 | 0.0 |
| SN(E/C) |

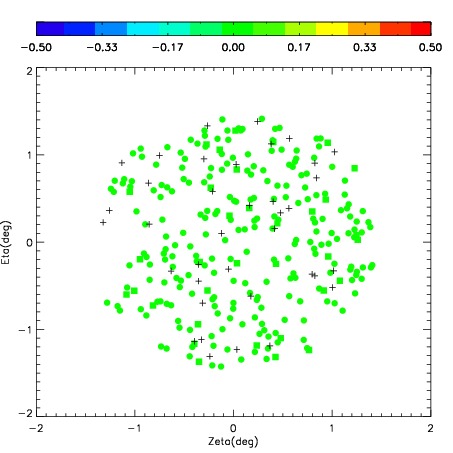
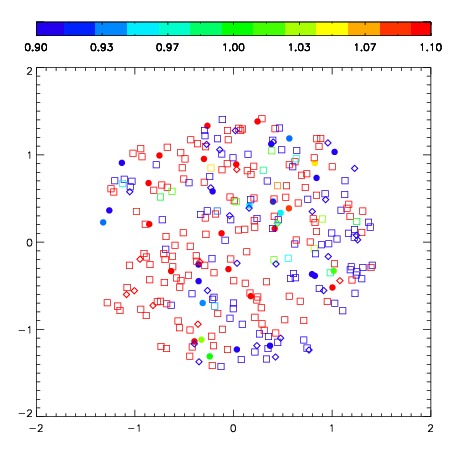
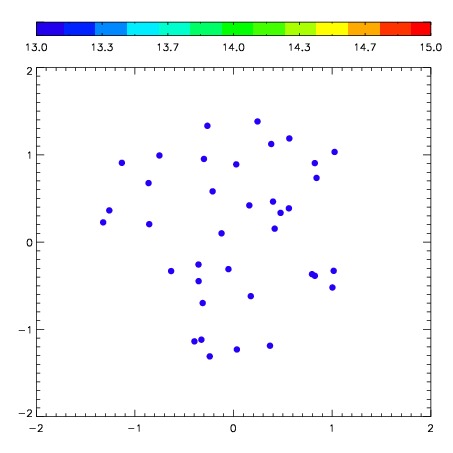
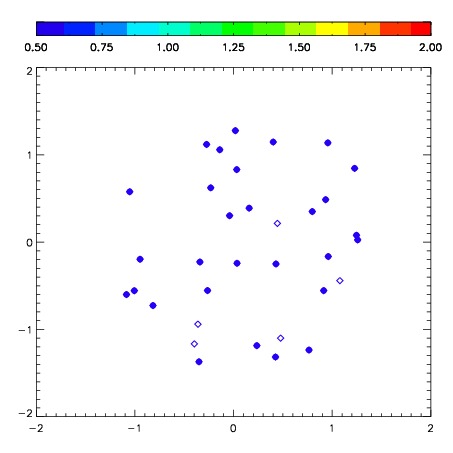
| Frame | Nreads | Zeropoints | Mag plots | Spatial mag deviation | Spatial sky 16325A emission deviations (filled: sky, open: star) | Spatial sky continuum emission | Spatial sky telluric CO2 absorption deviations (filled: H < 10) | |||||||||||||||||||||||
| 0 | 0 |
|
|
|
|
|
|
| IPAIR | NAME | SHIFT | NEWSHIFT | S/N | NAME | SHIFT | NEWSHIFT | S/N |
| 0 | 02860055 | 0.322609 | 0.00000 | 299.382 | 02860056 | -0.00351766 | 0.326127 | 295.174 |
| 1 | 02860054 | 0.318667 | 0.00394201 | 301.878 | 02860053 | 0.00000 | 0.322609 | 299.258 |
| 2 | 02860058 | 0.320244 | 0.00236499 | 282.452 | 02860057 | -0.00348957 | 0.326099 | 288.001 |
| 3 | 02860059 | 0.316765 | 0.00584400 | 275.036 | 02860060 | -0.00751169 | 0.330121 | 273.979 |