| Red | Green | Blue | |
| z | 17.64 | ||
| znorm | Inf | ||
| sky | -Inf | -Inf | -Inf |
| S/N | 16.8 | 30.7 | 34.5 |
| S/N(c) | 0.0 | 0.0 | 0.0 |
| SN(E/C) |


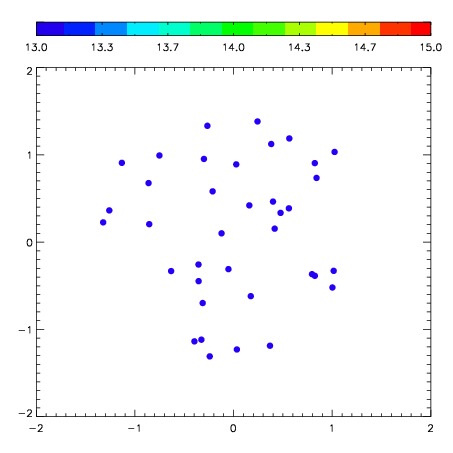
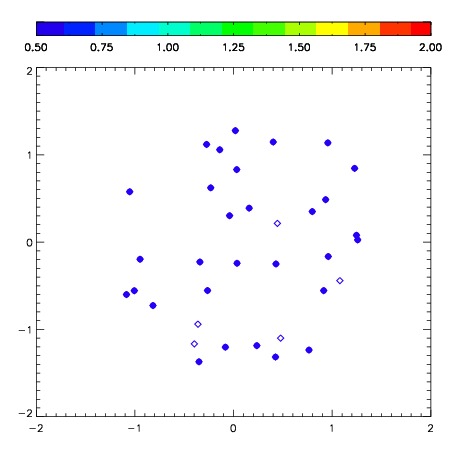
| Frame | Nreads | Zeropoints | Mag plots | Spatial mag deviation | Spatial sky 16325A emission deviations (filled: sky, open: star) | Spatial sky continuum emission | Spatial sky telluric CO2 absorption deviations (filled: H < 10) | |||||||||||||||||||||||
| 0 | 0 |
|
|
|
|
|
|
| IPAIR | NAME | SHIFT | NEWSHIFT | S/N | NAME | SHIFT | NEWSHIFT | S/N |
| 0 | 06650042 | 0.506811 | 0.00000 | 180.775 | 06650040 | 0.0346628 | 0.472148 | 201.837 |
| 1 | 06650039 | 0.501606 | 0.00520504 | 213.852 | 06650044 | 0.0402420 | 0.466569 | 213.131 |
| 2 | 06650038 | 0.506314 | 0.000497043 | 205.085 | 06650037 | 0.00000 | 0.506811 | 206.508 |
| 3 | 06650043 | 0.497900 | 0.00891101 | 189.736 | 06650041 | 0.0421186 | 0.464692 | 202.070 |