| Red | Green | Blue | |
| z | 17.64 | ||
| znorm | Inf | ||
| sky | -Inf | -NaN | -Inf |
| S/N | 25.5 | 44.5 | 47.8 |
| S/N(c) | 0.0 | 0.0 | 0.0 |
| SN(E/C) |

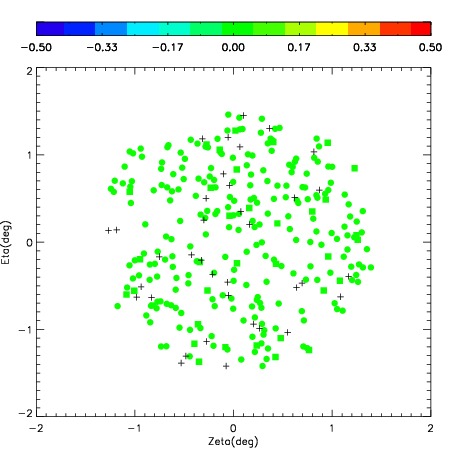

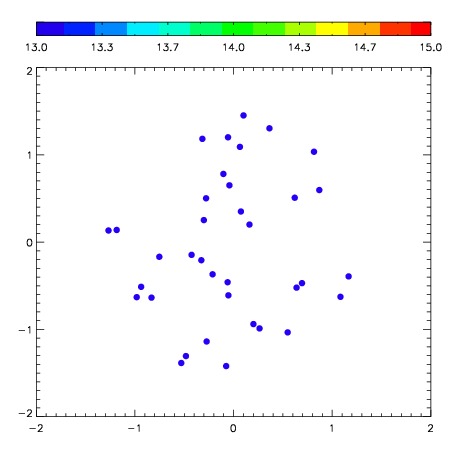

| Frame | Nreads | Zeropoints | Mag plots | Spatial mag deviation | Spatial sky 16325A emission deviations (filled: sky, open: star) | Spatial sky continuum emission | Spatial sky telluric CO2 absorption deviations (filled: H < 10) | |||||||||||||||||||||||
| 0 | 0 |
|
|
|
|
|
|
| IPAIR | NAME | SHIFT | NEWSHIFT | S/N | NAME | SHIFT | NEWSHIFT | S/N |
| 0 | 02830053 | 0.355324 | 0.00000 | 281.852 | 02830054 | 0.0126504 | 0.342674 | 285.760 |
| 1 | 02830049 | 0.345437 | 0.00988701 | 288.572 | 02830051 | 0.0110173 | 0.344307 | 287.947 |
| 2 | 02830052 | 0.347101 | 0.00822300 | 279.287 | 02830050 | 0.0131118 | 0.342212 | 284.454 |
| 3 | 02830048 | 0.350181 | 0.00514299 | 278.856 | 02830047 | 0.00000 | 0.355324 | 283.544 |