| Red | Green | Blue | |
| z | 17.64 | ||
| znorm | Inf | ||
| sky | -Inf | -Inf | -Inf |
| S/N | 27.7 | 49.0 | 54.4 |
| S/N(c) | 0.0 | 0.0 | 0.0 |
| SN(E/C) |


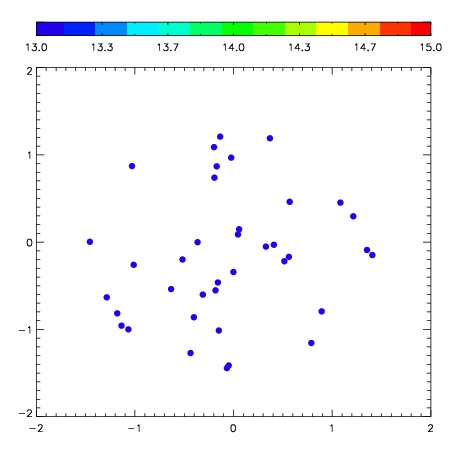
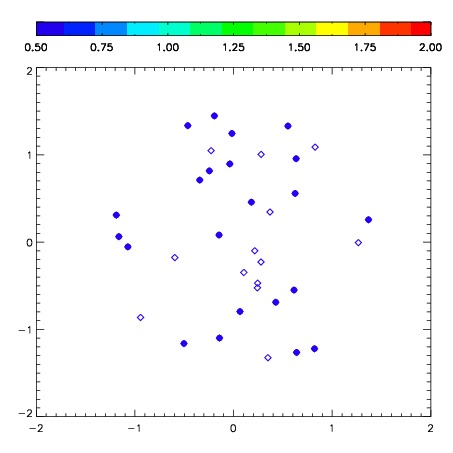
| Frame | Nreads | Zeropoints | Mag plots | Spatial mag deviation | Spatial sky 16325A emission deviations (filled: sky, open: star) | Spatial sky continuum emission | Spatial sky telluric CO2 absorption deviations (filled: H < 10) | |||||||||||||||||||||||
| 0 | 0 |
|
|
|
|
|
|
| IPAIR | NAME | SHIFT | NEWSHIFT | S/N | NAME | SHIFT | NEWSHIFT | S/N |
| 0 | 03340027 | 0.531712 | 0.00000 | 247.876 | 03340025 | 0.00000 | 0.531712 | 261.033 |
| 1 | 03340026 | 0.525853 | 0.00585902 | 254.751 | 03340032 | 0.0388882 | 0.492824 | 264.060 |
| 2 | 03340031 | 0.526435 | 0.00527698 | 230.820 | 03340028 | 0.0412357 | 0.490476 | 253.684 |
| 3 | 03340030 | 0.526178 | 0.00553399 | 0.00000 | 03340029 | 0.0380880 | 0.493624 | 247.976 |