| Red | Green | Blue | |
| z | 17.64 | ||
| znorm | Inf | ||
| sky | -Inf | -Inf | -Inf |
| S/N | 28.6 | 49.8 | 53.6 |
| S/N(c) | 0.0 | 0.0 | 0.0 |
| SN(E/C) |

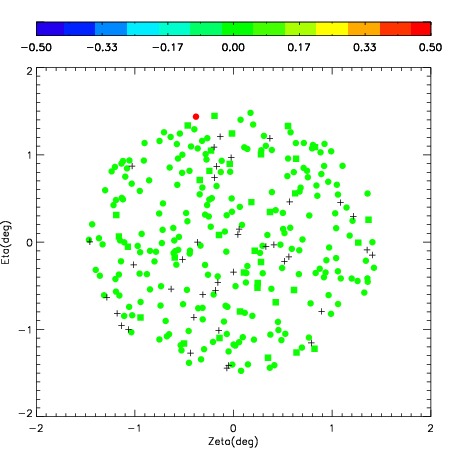
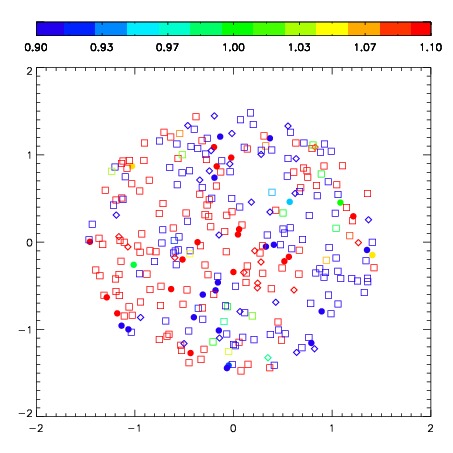

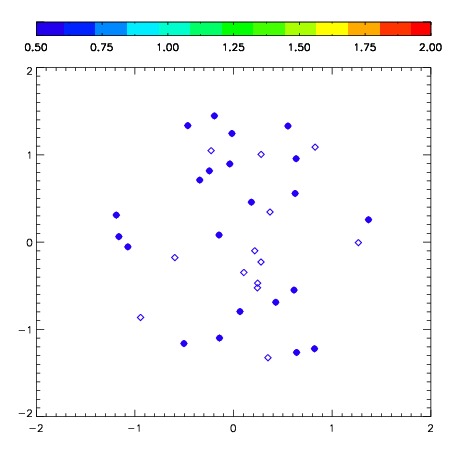
| Frame | Nreads | Zeropoints | Mag plots | Spatial mag deviation | Spatial sky 16325A emission deviations (filled: sky, open: star) | Spatial sky continuum emission | Spatial sky telluric CO2 absorption deviations (filled: H < 10) | |||||||||||||||||||||||
| 0 | 0 |
|
|
|
|
|
|
| IPAIR | NAME | SHIFT | NEWSHIFT | S/N | NAME | SHIFT | NEWSHIFT | S/N |
| 0 | 03430028 | 0.448360 | 0.00000 | 276.223 | 03430030 | 0.0217833 | 0.426577 | 275.347 |
| 1 | 03430025 | 0.443494 | 0.00486600 | 281.064 | 03430026 | 0.0185464 | 0.429814 | 281.678 |
| 2 | 03430024 | 0.442345 | 0.00601500 | 279.934 | 03430027 | 0.0186986 | 0.429661 | 279.566 |
| 3 | 03430029 | 0.443343 | 0.00501698 | 277.127 | 03430023 | 0.00000 | 0.448360 | 278.754 |