| Red | Green | Blue | |
| z | 17.64 | ||
| znorm | Inf | ||
| sky | -Inf | -Inf | -Inf |
| S/N | 14.9 | 27.4 | 29.9 |
| S/N(c) | 0.0 | 0.0 | 0.0 |
| SN(E/C) |
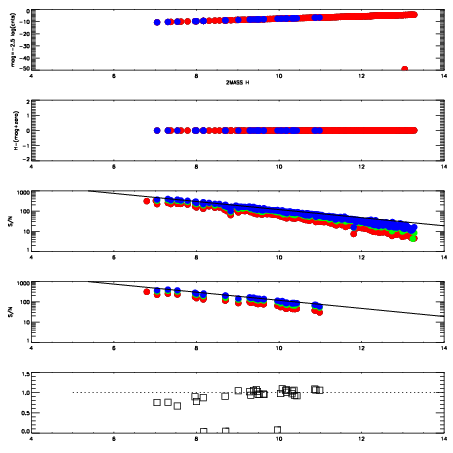
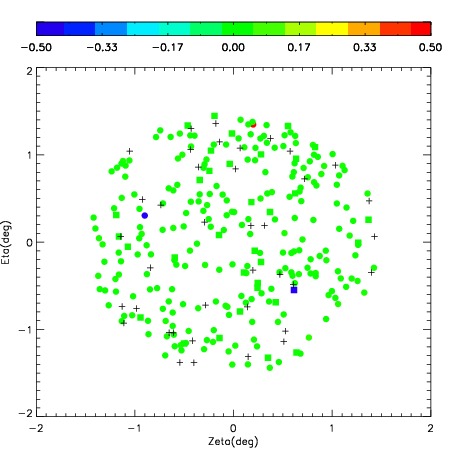
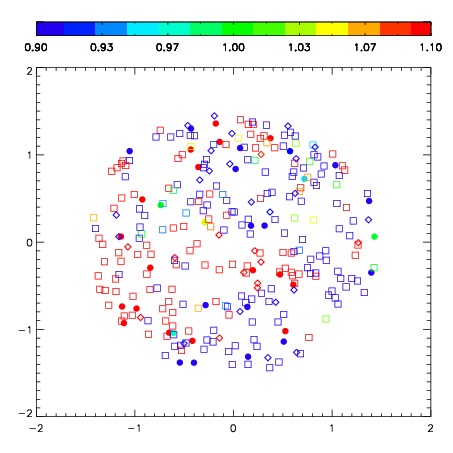
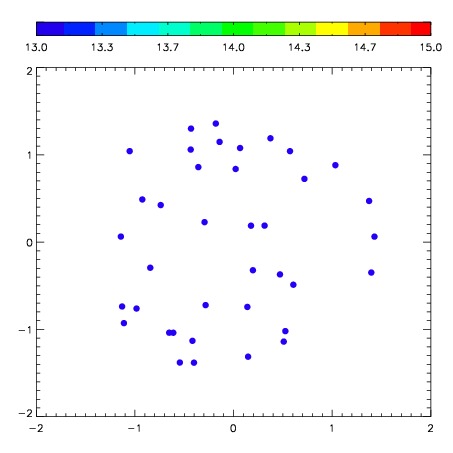
| Frame | Nreads | Zeropoints | Mag plots | Spatial mag deviation | Spatial sky 16325A emission deviations (filled: sky, open: star) | Spatial sky continuum emission | Spatial sky telluric CO2 absorption deviations (filled: H < 10) | |||||||||||||||||||||||
| 0 | 0 |
|
|
|
|
|
|
| IPAIR | NAME | SHIFT | NEWSHIFT | S/N | NAME | SHIFT | NEWSHIFT | S/N |
| 0 | 03440021 | 0.437610 | 0.00000 | 190.809 | 03440023 | -0.0157445 | 0.453355 | 0.00000 |
| 1 | 03440025 | 0.418609 | 0.0190010 | 254.118 | 03440019 | 0.00000 | 0.437610 | 320.697 |
| 2 | 03440020 | 0.424235 | 0.0133750 | 234.390 | 03440026 | -0.0108498 | 0.448460 | 216.958 |
| 3 | 03440024 | 0.425330 | 0.0122800 | 217.237 | 03440022 | -0.0101625 | 0.447773 | 172.430 |