| Red | Green | Blue | |
| z | 17.64 | ||
| znorm | Inf | ||
| sky | -Inf | -Inf | -Inf |
| S/N | 26.3 | 43.4 | 45.9 |
| S/N(c) | 0.0 | 0.0 | 0.0 |
| SN(E/C) |

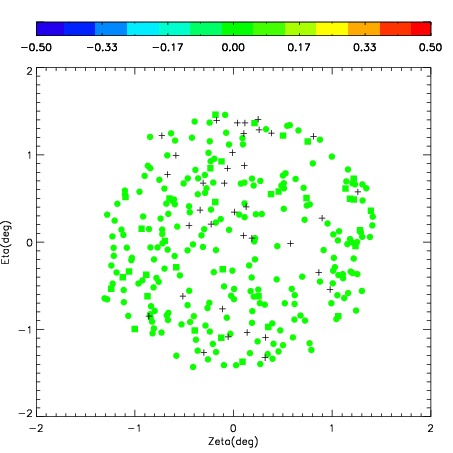
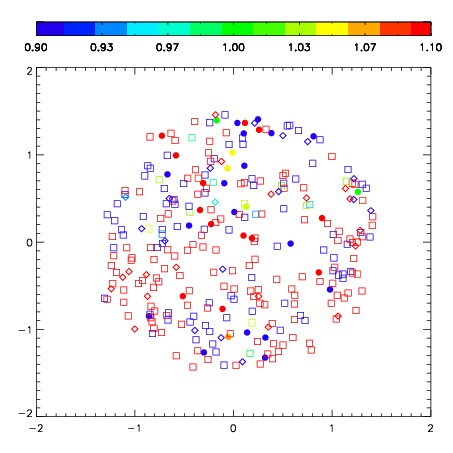


| Frame | Nreads | Zeropoints | Mag plots | Spatial mag deviation | Spatial sky 16325A emission deviations (filled: sky, open: star) | Spatial sky continuum emission | Spatial sky telluric CO2 absorption deviations (filled: H < 10) | |||||||||||||||||||||||
| 0 | 0 |
|
|
|
|
|
|
| IPAIR | NAME | SHIFT | NEWSHIFT | S/N | NAME | SHIFT | NEWSHIFT | S/N |
| 0 | 02890051 | 0.335376 | 0.00000 | 298.181 | 02890049 | 0.00000 | 0.335376 | 292.095 |
| 1 | 02890054 | 0.330020 | 0.00535598 | 301.700 | 02890052 | -0.0108620 | 0.346238 | 298.449 |
| 2 | 02890055 | 0.330616 | 0.00476000 | 299.614 | 02890056 | -0.00639865 | 0.341775 | 293.577 |
| 3 | 02890050 | 0.328281 | 0.00709501 | 293.537 | 02890053 | -0.00930148 | 0.344677 | 283.794 |