| Red | Green | Blue | |
| z | 17.64 | ||
| znorm | Inf | ||
| sky | -Inf | -Inf | -Inf |
| S/N | 24.1 | 40.3 | 44.3 |
| S/N(c) | 0.0 | 0.0 | 0.0 |
| SN(E/C) |

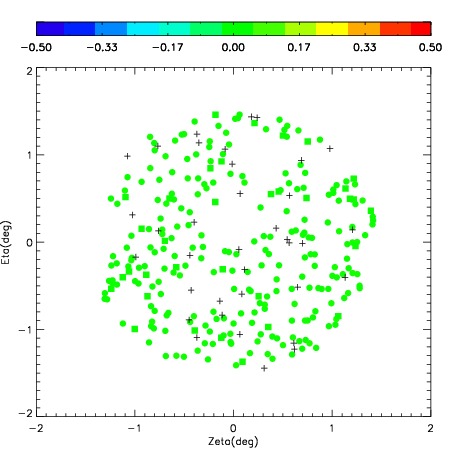
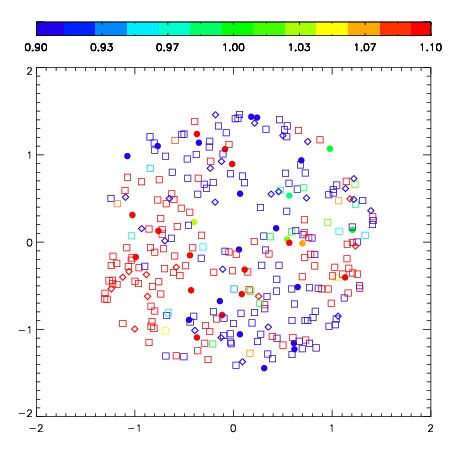


| Frame | Nreads | Zeropoints | Mag plots | Spatial mag deviation | Spatial sky 16325A emission deviations (filled: sky, open: star) | Spatial sky continuum emission | Spatial sky telluric CO2 absorption deviations (filled: H < 10) | |||||||||||||||||||||||
| 0 | 0 |
|
|
|
|
|
|
| IPAIR | NAME | SHIFT | NEWSHIFT | S/N | NAME | SHIFT | NEWSHIFT | S/N |
| 0 | 02880044 | 0.295848 | 0.00000 | 203.865 | 02880045 | -0.0400091 | 0.335857 | 204.856 |
| 1 | 02880039 | 0.294027 | 0.00182101 | 218.981 | 02880041 | -0.0346784 | 0.330526 | 218.512 |
| 2 | 02880040 | 0.294131 | 0.00171700 | 216.996 | 02880038 | 0.00000 | 0.295848 | 209.807 |
| 3 | 02880043 | 0.291419 | 0.00442901 | 207.670 | 02880042 | -0.0415812 | 0.337429 | 206.595 |