| Red | Green | Blue | |
| z | 17.64 | ||
| znorm | Inf | ||
| sky | -Inf | -Inf | -Inf |
| S/N | 23.0 | 41.6 | 45.9 |
| S/N(c) | 0.0 | 0.0 | 0.0 |
| SN(E/C) |

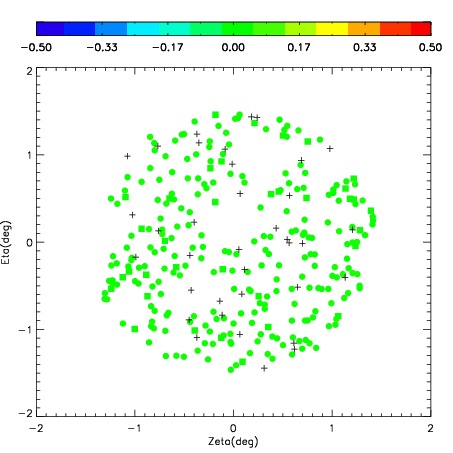
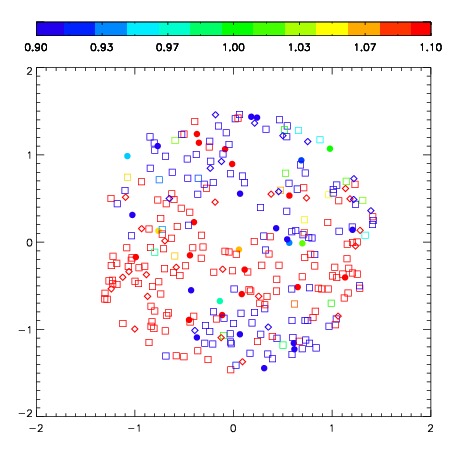
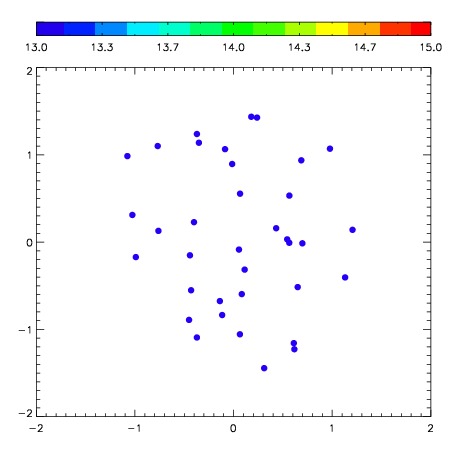
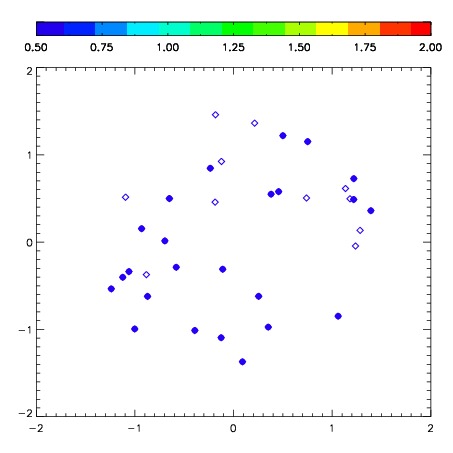
| Frame | Nreads | Zeropoints | Mag plots | Spatial mag deviation | Spatial sky 16325A emission deviations (filled: sky, open: star) | Spatial sky continuum emission | Spatial sky telluric CO2 absorption deviations (filled: H < 10) | |||||||||||||||||||||||
| 0 | 0 |
|
|
|
|
|
|
| IPAIR | NAME | SHIFT | NEWSHIFT | S/N | NAME | SHIFT | NEWSHIFT | S/N |
| 0 | 03090036 | 0.479333 | 0.00000 | 227.506 | 03090037 | 0.0160607 | 0.463272 | 224.606 |
| 1 | 03090035 | 0.477314 | 0.00201902 | 229.063 | 03090041 | 0.0149825 | 0.464351 | 225.885 |
| 2 | 03090040 | 0.479145 | 0.000188023 | 223.243 | 03090034 | 0.00000 | 0.479333 | 221.094 |
| 3 | 03090039 | 0.475868 | 0.00346503 | 218.522 | 03090038 | 0.0128393 | 0.466494 | 215.712 |