| Red | Green | Blue | |
| z | 17.64 | ||
| znorm | Inf | ||
| sky | -Inf | -Inf | -Inf |
| S/N | 21.1 | 37.6 | 45.7 |
| S/N(c) | 0.0 | 0.0 | 0.0 |
| SN(E/C) |

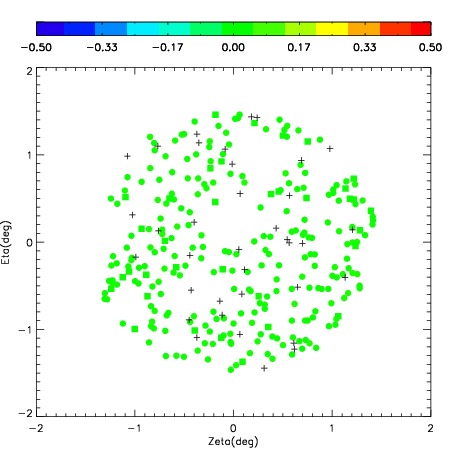
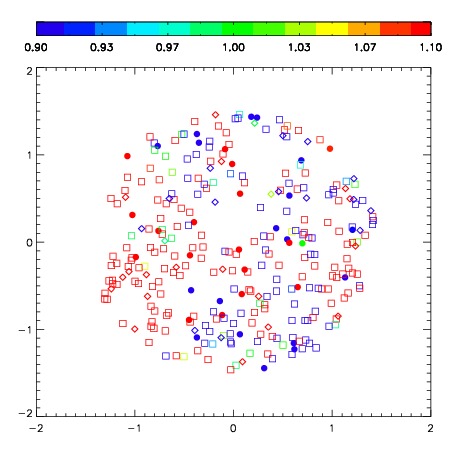
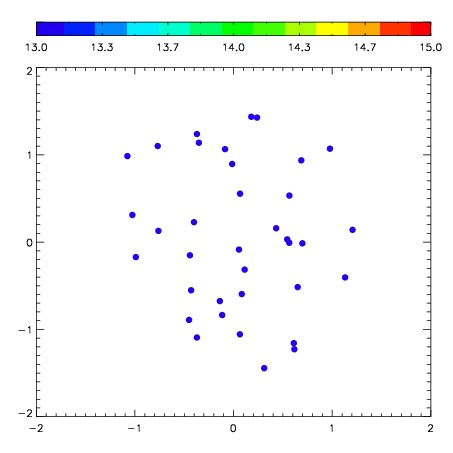
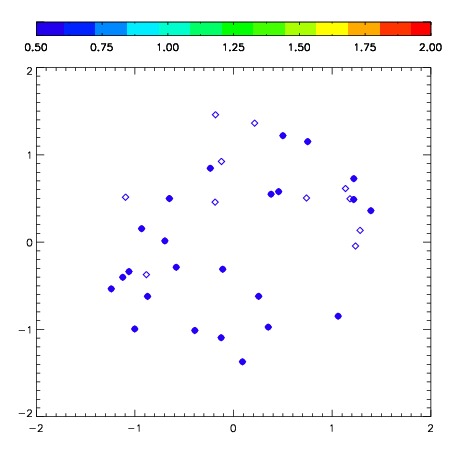
| Frame | Nreads | Zeropoints | Mag plots | Spatial mag deviation | Spatial sky 16325A emission deviations (filled: sky, open: star) | Spatial sky continuum emission | Spatial sky telluric CO2 absorption deviations (filled: H < 10) | |||||||||||||||||||||||
| 0 | 0 |
|
|
|
|
|
|
| IPAIR | NAME | SHIFT | NEWSHIFT | S/N | NAME | SHIFT | NEWSHIFT | S/N |
| 0 | 06420049 | 0.400359 | 0.00000 | 207.610 | 06420048 | -0.00513358 | 0.405493 | 224.456 |
| 1 | 06420046 | 0.394930 | 0.00542900 | 231.643 | 06420047 | 0.000768386 | 0.399591 | 224.580 |
| 2 | 06420050 | 0.393190 | 0.00716901 | 206.943 | 06420051 | -0.000602357 | 0.400961 | 224.290 |
| 3 | 06420045 | 0.396945 | 0.00341401 | 206.395 | 06420044 | 0.00000 | 0.400359 | 180.766 |