| Red | Green | Blue | |
| z | 17.64 | ||
| znorm | Inf | ||
| sky | -Inf | -Inf | -Inf |
| S/N | 18.6 | 33.3 | 37.4 |
| S/N(c) | 0.0 | 0.0 | 0.0 |
| SN(E/C) |


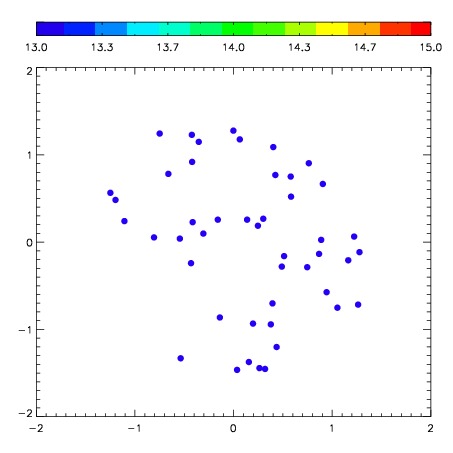
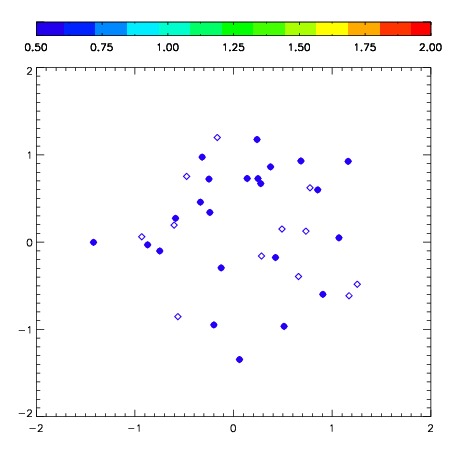
| Frame | Nreads | Zeropoints | Mag plots | Spatial mag deviation | Spatial sky 16325A emission deviations (filled: sky, open: star) | Spatial sky continuum emission | Spatial sky telluric CO2 absorption deviations (filled: H < 10) | |||||||||||||||||||||||
| 0 | 0 |
|
|
|
|
|
|
| IPAIR | NAME | SHIFT | NEWSHIFT | S/N | NAME | SHIFT | NEWSHIFT | S/N |
| 0 | 02620052 | 0.407286 | 0.00000 | 48.4084 | 02620051 | 0.00000 | 0.407286 | 169.643 |
| 1 | 02620057 | 0.367550 | 0.0397360 | 224.547 | 02620054 | 0.0198618 | 0.387424 | 223.175 |
| 2 | 02620056 | 0.368317 | 0.0389690 | 209.546 | 02620058 | 0.0189057 | 0.388380 | 220.153 |
| 3 | 02620053 | 0.384045 | 0.0232410 | 147.135 | 02620055 | 0.0172546 | 0.390031 | 213.036 |