| Red | Green | Blue | |
| z | 17.64 | ||
| znorm | Inf | ||
| sky | -NaN | -NaN | -Inf |
| S/N | 35.2 | 58.2 | 62.5 |
| S/N(c) | 0.0 | 0.0 | 0.0 |
| SN(E/C) |

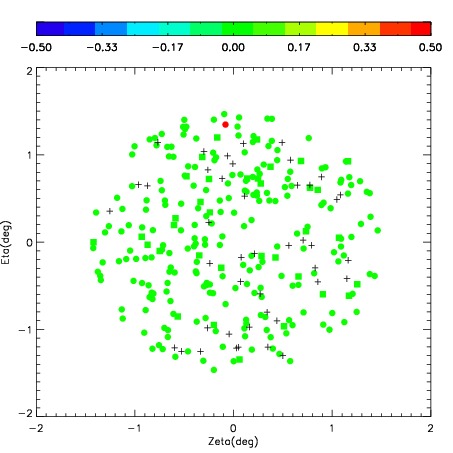

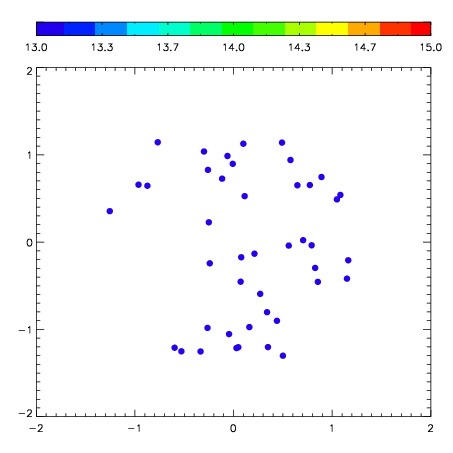
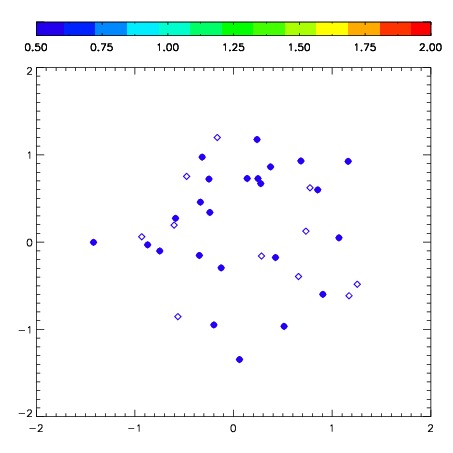
| Frame | Nreads | Zeropoints | Mag plots | Spatial mag deviation | Spatial sky 16325A emission deviations (filled: sky, open: star) | Spatial sky continuum emission | Spatial sky telluric CO2 absorption deviations (filled: H < 10) | |||||||||||||||||||||||
| 0 | 0 |
|
|
|
|
|
|
| IPAIR | NAME | SHIFT | NEWSHIFT | S/N | NAME | SHIFT | NEWSHIFT | S/N |
| 0 | 03650033 | 0.448693 | 0.00000 | 206.471 | 03650039 | -0.00214483 | 0.450838 | 217.567 |
| 1 | 03650034 | 0.443661 | 0.00503200 | 215.121 | 03650035 | -0.00487435 | 0.453567 | 218.205 |
| 2 | 03650037 | 0.441734 | 0.00695902 | 213.272 | 03650036 | -0.00605360 | 0.454747 | 217.884 |
| 3 | 03650038 | 0.439626 | 0.00906700 | 205.779 | 03650040 | -0.00518307 | 0.453876 | 214.382 |
| 4 | 03650041 | 0.430474 | 0.0182190 | 205.033 | 03650032 | 0.00000 | 0.448693 | 213.621 |
| 5 | 03650042 | 0.430748 | 0.0179450 | 196.143 | 03650043 | -0.00481018 | 0.453503 | 206.257 |