| Red | Green | Blue | |
| z | 17.64 | ||
| znorm | Inf | ||
| sky | -NaN | -NaN | -Inf |
| S/N | 26.3 | 45.8 | 49.4 |
| S/N(c) | 0.0 | 0.0 | 0.0 |
| SN(E/C) |


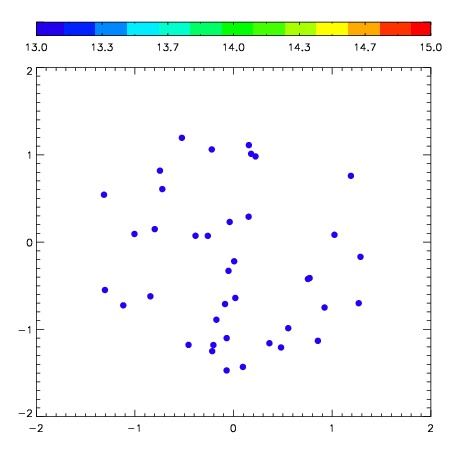
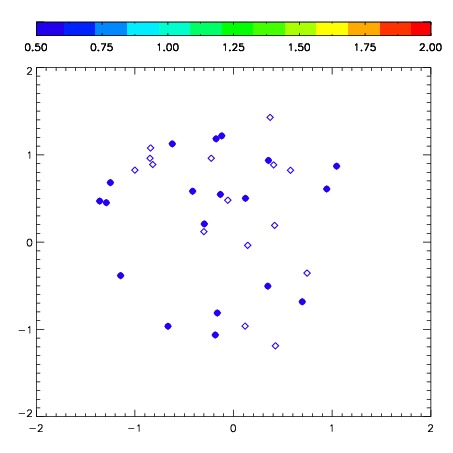
| Frame | Nreads | Zeropoints | Mag plots | Spatial mag deviation | Spatial sky 16325A emission deviations (filled: sky, open: star) | Spatial sky continuum emission | Spatial sky telluric CO2 absorption deviations (filled: H < 10) | |||||||||||||||||||||||
| 0 | 0 |
|
|
|
|
|
|
| IPAIR | NAME | SHIFT | NEWSHIFT | S/N | NAME | SHIFT | NEWSHIFT | S/N |
| 0 | 02910011 | 0.281771 | 0.00000 | 279.688 | 02910014 | -0.0343256 | 0.316097 | 277.181 |
| 1 | 02910019 | 0.257336 | 0.0244350 | 283.212 | 02910017 | -0.0383820 | 0.320153 | 283.240 |
| 2 | 02910016 | 0.261428 | 0.0203430 | 280.400 | 02910018 | -0.0381498 | 0.319921 | 280.738 |
| 3 | 02910015 | 0.265785 | 0.0159860 | 276.342 | 02910010 | 0.00000 | 0.281771 | 273.675 |
| 4 | 02910012 | 0.273301 | 0.00847000 | 273.458 | 02910013 | -0.0387065 | 0.320478 | 272.489 |