| Red | Green | Blue | |
| z | 17.63 | ||
| znorm | Inf | ||
| sky | -NaN | -NaN | -Inf |
| S/N | 25.1 | 42.4 | 48.1 |
| S/N(c) | 0.0 | 0.0 | 0.0 |
| SN(E/C) |

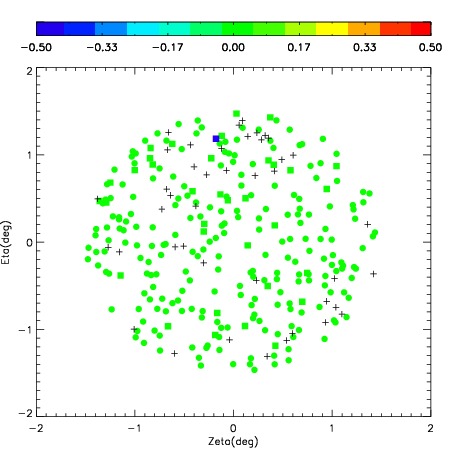
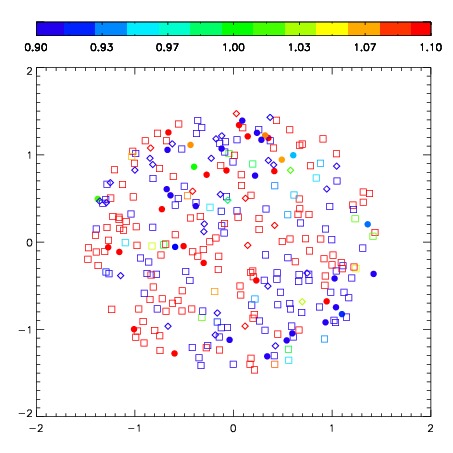


| Frame | Nreads | Zeropoints | Mag plots | Spatial mag deviation | Spatial sky 16325A emission deviations (filled: sky, open: star) | Spatial sky continuum emission | Spatial sky telluric CO2 absorption deviations (filled: H < 10) | |||||||||||||||||||||||
| 0 | 0 |
|
|
|
|
|
|
| IPAIR | NAME | SHIFT | NEWSHIFT | S/N | NAME | SHIFT | NEWSHIFT | S/N |
| 0 | 02860065 | 0.320901 | 0.00000 | 267.687 | 02860064 | 0.00000 | 0.320901 | 265.230 |
| 1 | 02860070 | 0.320767 | 0.000134021 | 273.863 | 02860071 | -0.0176877 | 0.338589 | 273.773 |
| 2 | 02860066 | 0.318967 | 0.00193399 | 271.298 | 02860067 | -0.0192357 | 0.340137 | 270.439 |
| 3 | 02860069 | 0.314332 | 0.00656900 | 271.214 | 02860068 | -0.0190280 | 0.339929 | 268.006 |