| Red | Green | Blue | |
| z | 17.64 | ||
| znorm | Inf | ||
| sky | -NaN | -Inf | -Inf |
| S/N | 28.9 | 49.8 | 54.0 |
| S/N(c) | 0.0 | 0.0 | 0.0 |
| SN(E/C) |

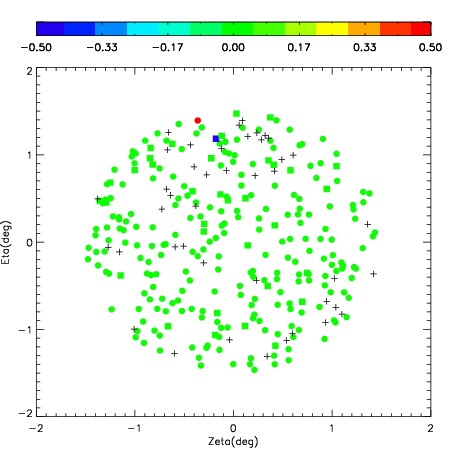
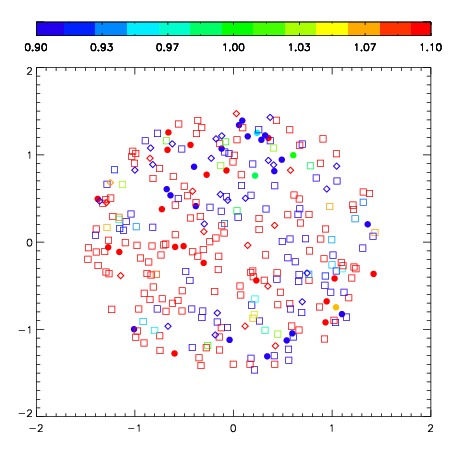


| Frame | Nreads | Zeropoints | Mag plots | Spatial mag deviation | Spatial sky 16325A emission deviations (filled: sky, open: star) | Spatial sky continuum emission | Spatial sky telluric CO2 absorption deviations (filled: H < 10) | |||||||||||||||||||||||
| 0 | 0 |
|
|
|
|
|
|
| IPAIR | NAME | SHIFT | NEWSHIFT | S/N | NAME | SHIFT | NEWSHIFT | S/N |
| 0 | 03970012 | 0.433909 | 0.00000 | 259.557 | 03970010 | 0.00000 | 0.433909 | 262.268 |
| 1 | 03970016 | 0.428704 | 0.00520501 | 273.207 | 03970017 | -0.00831284 | 0.442222 | 266.559 |
| 2 | 03970019 | 0.431818 | 0.00209099 | 256.521 | 03970013 | -0.00824244 | 0.442151 | 246.766 |
| 3 | 03970015 | 0.432461 | 0.00144801 | 252.003 | 03970018 | -0.00901608 | 0.442925 | 245.866 |
| 4 | 03970011 | 0.431069 | 0.00284001 | 242.398 | 03970014 | -0.00830165 | 0.442211 | 241.097 |