| Red | Green | Blue | |
| z | 17.64 | ||
| znorm | Inf | ||
| sky | -NaN | -NaN | -Inf |
| S/N | 17.1 | 28.6 | 30.7 |
| S/N(c) | 0.0 | 0.0 | 0.0 |
| SN(E/C) |
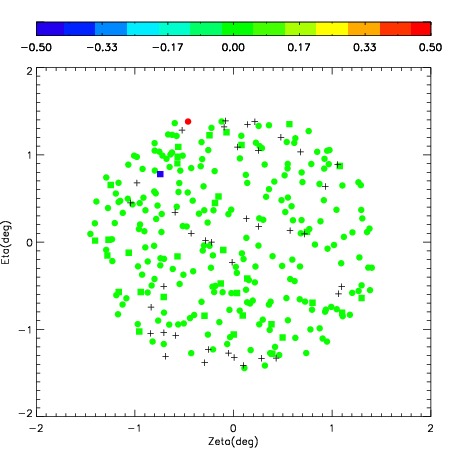

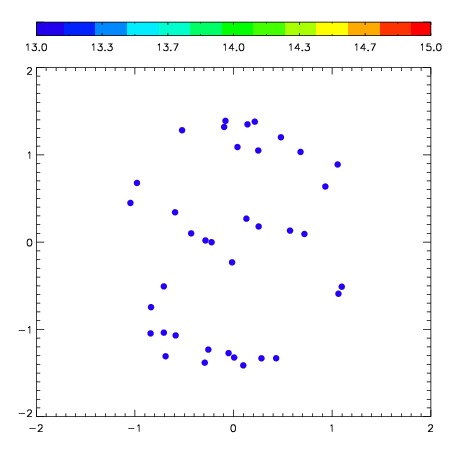
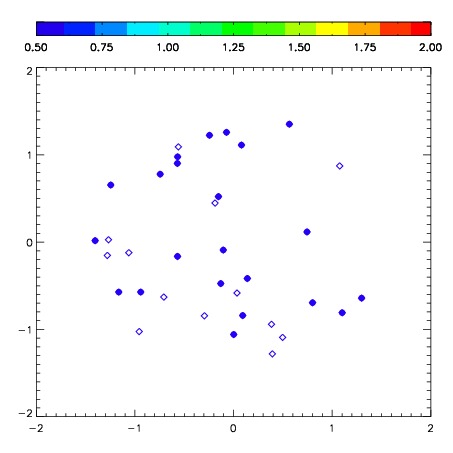
| Frame | Nreads | Zeropoints | Mag plots | Spatial mag deviation | Spatial sky 16325A emission deviations (filled: sky, open: star) | Spatial sky continuum emission | Spatial sky telluric CO2 absorption deviations (filled: H < 10) | |||||||||||||||||||||||
| 0 | 0 |
|
|
|
|
|
|
| IPAIR | NAME | SHIFT | NEWSHIFT | S/N | NAME | SHIFT | NEWSHIFT | S/N |
| 0 | 03420031 | 0.315491 | 0.00000 | 209.016 | 03420032 | -0.0729493 | 0.388440 | 219.937 |
| 1 | 03420026 | 0.300272 | 0.0152190 | 264.616 | 03420025 | 0.00000 | 0.315491 | 245.258 |
| 2 | 03420027 | 0.300965 | 0.0145260 | 246.723 | 03420029 | -0.0588335 | 0.374325 | 231.534 |
| 3 | 03420030 | 0.299246 | 0.0162450 | 230.165 | 03420028 | -0.0599359 | 0.375427 | 221.722 |