| Frame | Nreads | Zeropoints | Mag plots
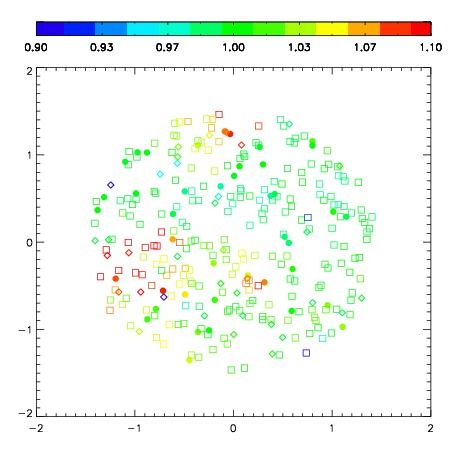
| Spatial mag deviation
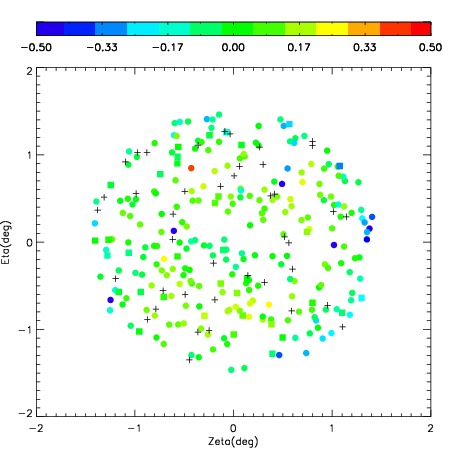
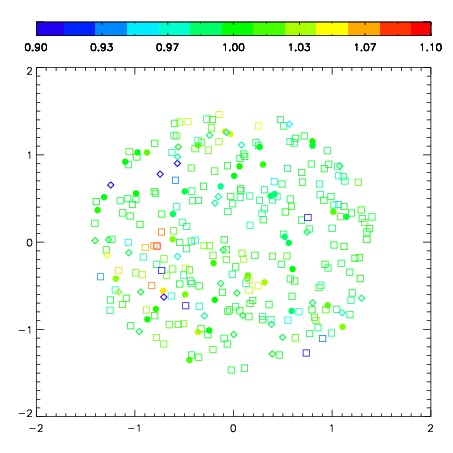
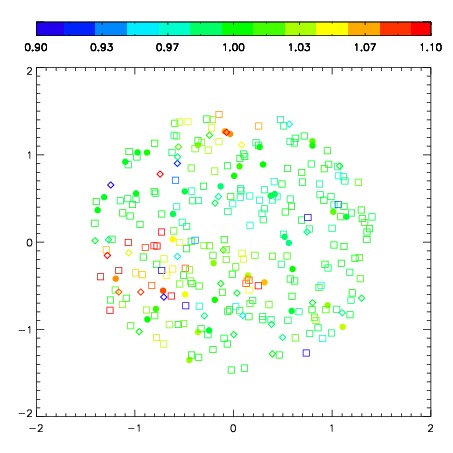
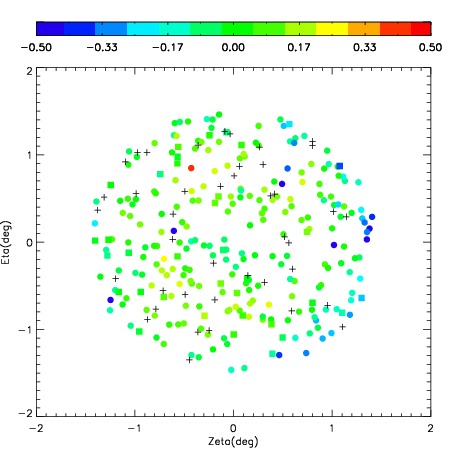
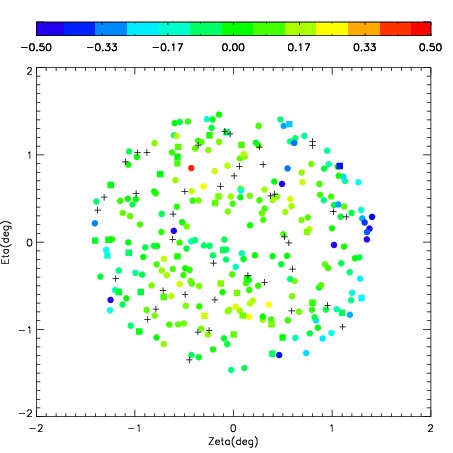
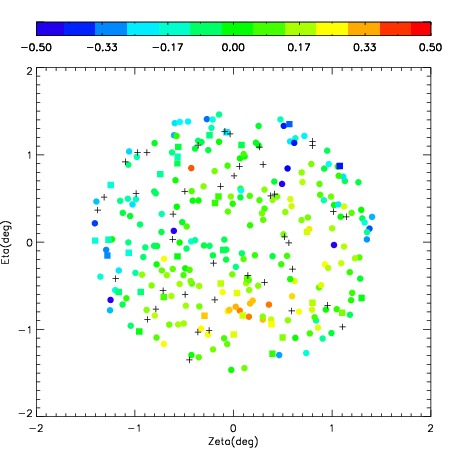
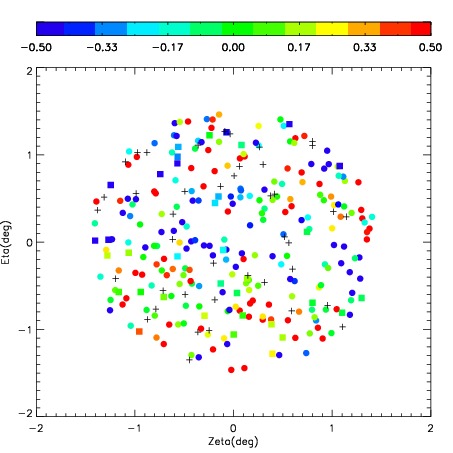
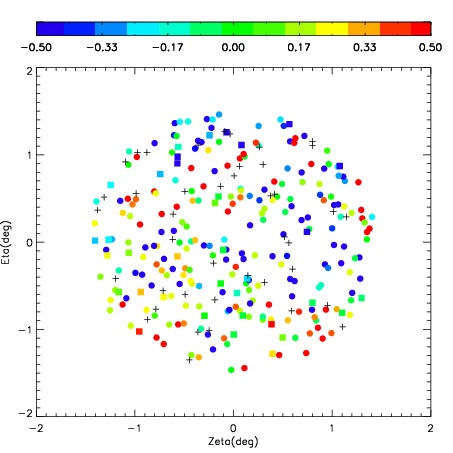
| Spatial sky 16325A emission deviations (filled: sky, open: star)
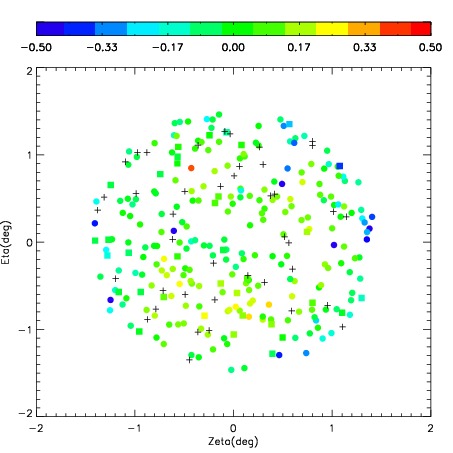
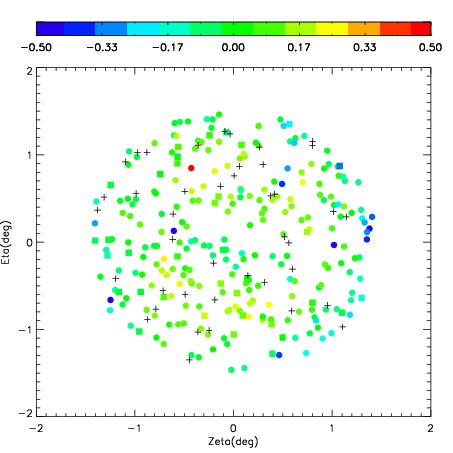
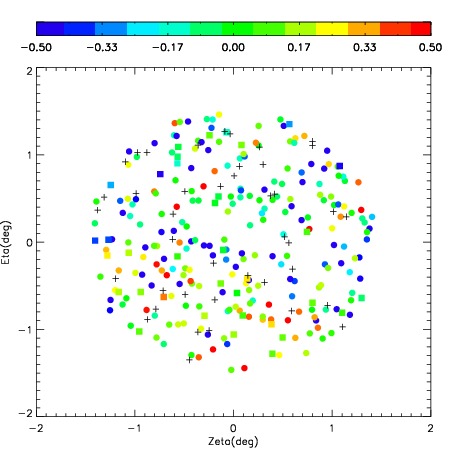
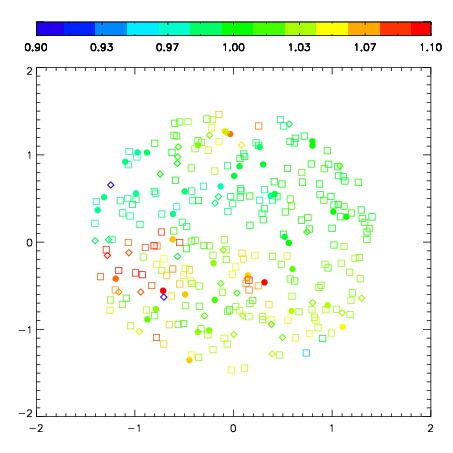
| Spatial sky continuum emission
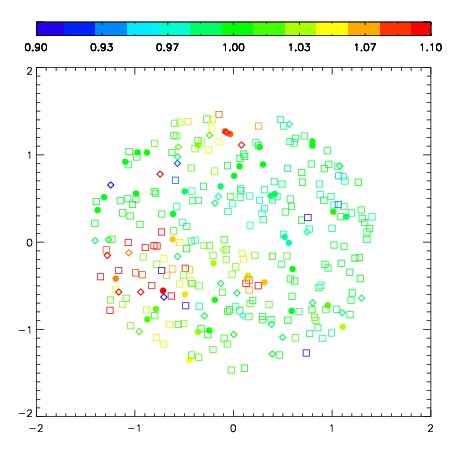
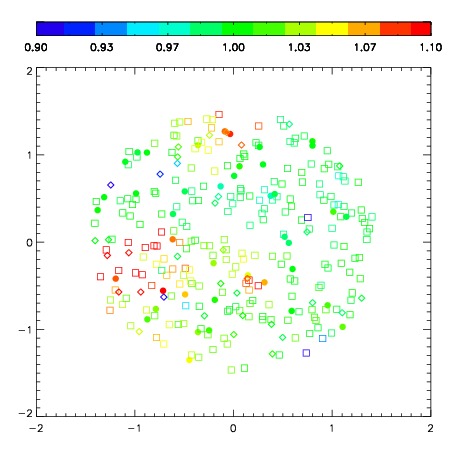
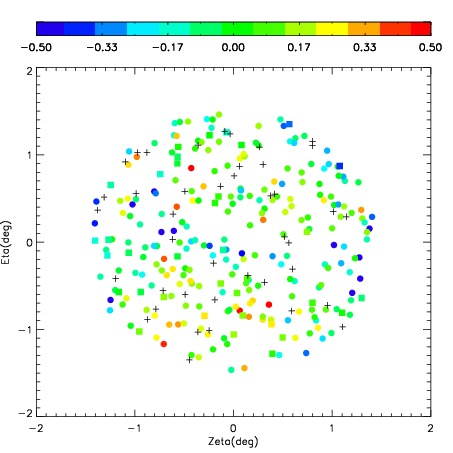
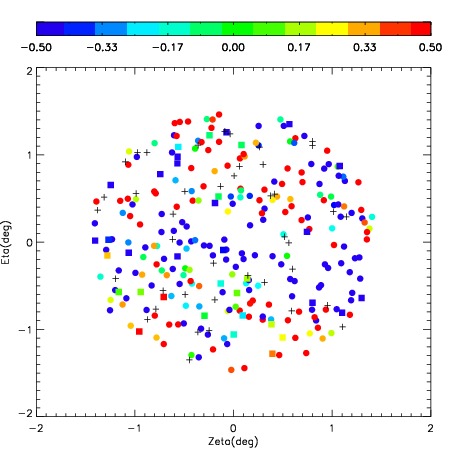
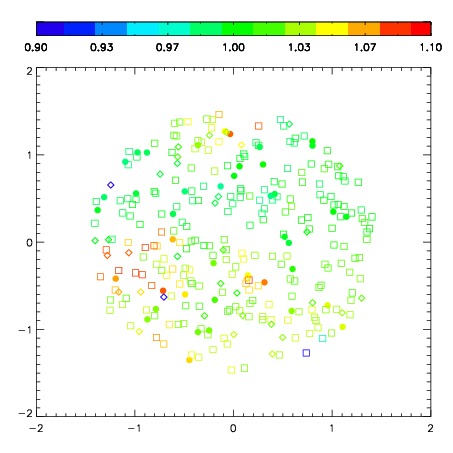
| Spatial sky telluric CO2 absorption deviations (filled: H < 10)
|
| 3220010
| 47
| | Red | Green | Blue
| | z | | 18.50
| | znorm | | 14.32
| | sky | 15.1 | 15.0 | 14.9
| | S/N | 10.0 | 18.1 | 18.8
| | S/N(c) | 8.6 | 16.8 | 17.4
| | SN(E/C) 1.02
|
| 
| 
| 
| 
| 
|
| 3220011
| 47
| | Red | Green | Blue
| | z | | 19.00
| | znorm | | 14.82
| | sky | 15.3 | 15.1 | 15.4
| | S/N | 14.5 | 24.6 | 25.8
| | S/N(c) | 12.7 | 23.2 | 24.3
| | SN(E/C) 0.99
|
| 
| 
| 
| 
| 
|
| 3220012
| 47
| | Red | Green | Blue
| | z | | 18.97
| | znorm | | 14.79
| | sky | 15.2 | 15.3 | 15.7
| | S/N | 14.0 | 24.0 | 25.3
| | S/N(c) | 12.3 | 22.7 | 23.7
| | SN(E/C) 0.99
|
| 
| 
| 
| 
| 
|
| 3220013
| 47
| | Red | Green | Blue
| | z | | 17.95
| | znorm | | 13.77
| | sky | 15.2 | 15.0 | 15.3
| | S/N | 6.3 | 12.9 | 13.1
| | S/N(c) | 5.4 | 11.8 | 12.0
| | SN(E/C) 1.02
|
| 
| 
| 
| 
| 
|
| 3220014
| 47
| | Red | Green | Blue
| | z | | 17.89
| | znorm | | 13.71
| | sky | 15.2 | 14.9 | 15.3
| | S/N | 6.4 | 12.7 | 12.8
| | S/N(c) | 5.5 | 11.5 | 11.6
| | SN(E/C) 1.00
|
| 
| 
| 
| 
| 
|
| 3220015
| 47
| | Red | Green | Blue
| | z | | 17.68
| | znorm | | 13.50
| | sky | 15.4 | 14.9 | 15.3
| | S/N | 5.2 | 10.9 | 10.8
| | S/N(c) | 4.3 | 9.8 | 9.8
| | SN(E/C) 1.00
|
| 
| 
| 
| 
| 
|
| 3220016
| 47
| | Red | Green | Blue
| | z | | 14.38
| | znorm | | 10.20
| | sky | 15.1 | 14.9 | 15.7
| | S/N | 0.3 | 0.6 | 0.5
| | S/N(c) | 0.3 | 0.8 | 0.7
| | SN(E/C) 1.06
|
| 
| 
| 
| 
| 
|
| 3220017
| 47
| | Red | Green | Blue
| | z | | 17.00
| | znorm | | 12.82
| | sky | 14.9 | 14.8 | 15.2
| | S/N | 3.0 | 7.0 | 7.1
| | S/N(c) | 2.7 | 6.1 | 6.3
| | SN(E/C) 1.00
|
| 
| 
| 
| 
| 
|
| 3220018
| 47
| | Red | Green | Blue
| | z | | 15.14
| | znorm | | 10.96
| | sky | 14.8 | 15.0 | 15.4
| | S/N | 0.4 | 1.5 | 1.5
| | S/N(c) | 0.4 | 1.4 | 1.4
| | SN(E/C) 1.16
|
| 
| 
| 
| 
| 
|
| 3220019
| 47
| | Red | Green | Blue
| | z | | 13.48
| | znorm | | 9.30
| | sky | 15.1 | 15.0 | 15.7
| | S/N | -0.0 | 0.3 | 0.2
| | S/N(c) | 0.0 | 0.0 | 0.0
| | SN(E/C) 1.83
|
| 
| 
| 
| 
| 
|
| 3220020
| 47
| | Red | Green | Blue
| | z | | 12.64
| | znorm | | 8.46
| | sky | 15.1 | 15.2 | 15.9
| | S/N | 0.0 | 0.3 | 0.2
| | S/N(c) | 0.0 | 0.0 | 0.0
| | SN(E/C) 2.63
|
| 
| 
| 
| 
| 
|
| 3220021
| 47
| | Red | Green | Blue
| | z | | 13.83
| | znorm | | 9.65
| | sky | 15.2 | 15.1 | 15.7
| | S/N | 0.0 | 0.5 | 0.2
| | S/N(c) | 0.0 | 0.0 | 0.0
| | SN(E/C) 1.34
|
| 
| 
| 
| 
| 
|