| Red | Green | Blue | |
| z | 17.64 | ||
| znorm | Inf | ||
| sky | -Inf | -Inf | -Inf |
| S/N | 22.5 | 41.3 | 44.1 |
| S/N(c) | 0.0 | 0.0 | 0.0 |
| SN(E/C) |


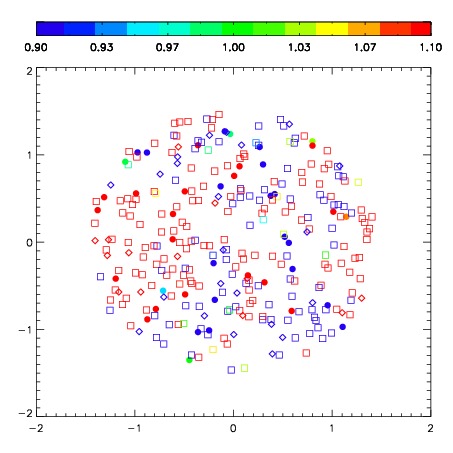
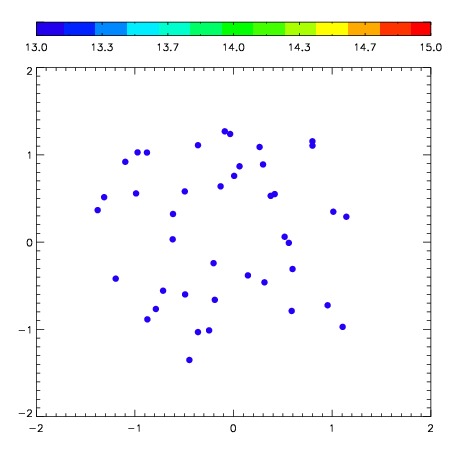
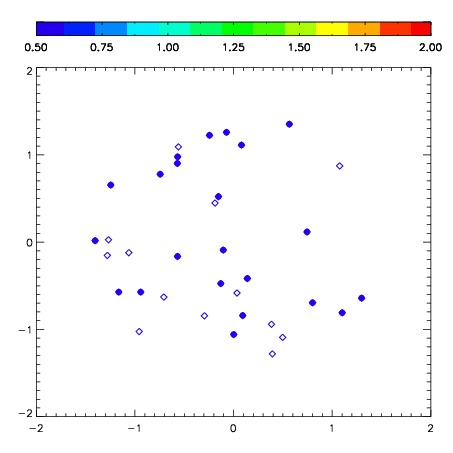
| Frame | Nreads | Zeropoints | Mag plots | Spatial mag deviation | Spatial sky 16325A emission deviations (filled: sky, open: star) | Spatial sky continuum emission | Spatial sky telluric CO2 absorption deviations (filled: H < 10) | |||||||||||||||||||||||
| 0 | 0 |
|
|
|
|
|
|
| IPAIR | NAME | SHIFT | NEWSHIFT | S/N | NAME | SHIFT | NEWSHIFT | S/N |
| 0 | 03480031 | 0.408754 | 0.00000 | 210.099 | 03480028 | 0.0210265 | 0.387727 | 216.741 |
| 1 | 03480026 | 0.403717 | 0.00503698 | 227.420 | 03480025 | 0.00000 | 0.408754 | 226.096 |
| 2 | 03480030 | 0.390888 | 0.0178660 | 218.639 | 03480029 | 0.0209483 | 0.387806 | 223.141 |
| 3 | 03480027 | 0.407156 | 0.00159800 | 204.063 | 03480032 | 0.0191445 | 0.389609 | 203.142 |