| Red | Green | Blue | |
| z | 17.64 | ||
| znorm | Inf | ||
| sky | -Inf | -Inf | -Inf |
| S/N | 27.0 | 46.4 | 50.4 |
| S/N(c) | 0.0 | 0.0 | 0.0 |
| SN(E/C) |
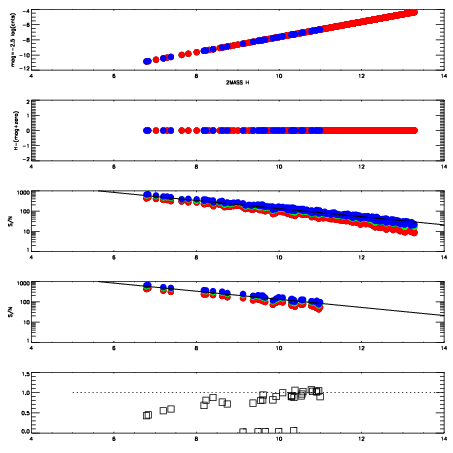
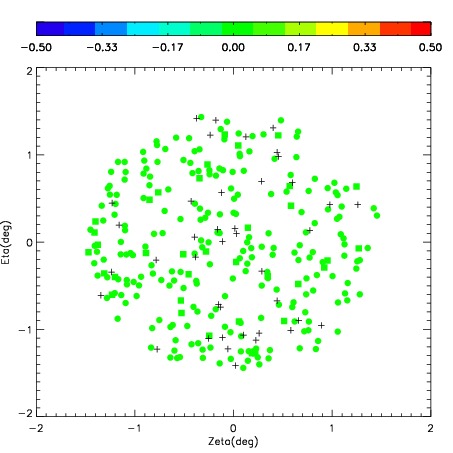
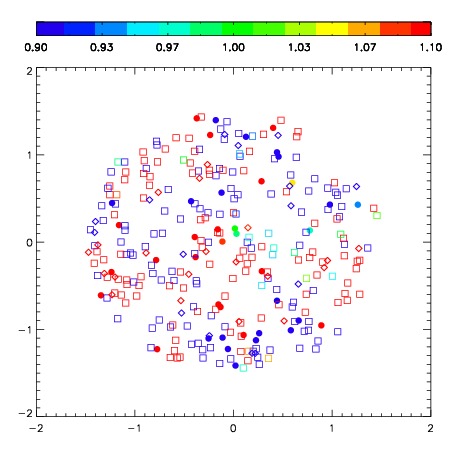
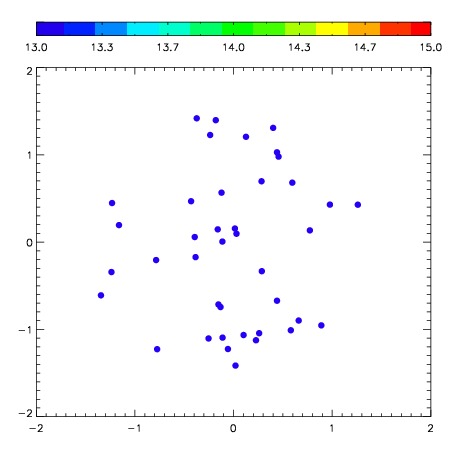
| Frame | Nreads | Zeropoints | Mag plots | Spatial mag deviation | Spatial sky 16325A emission deviations (filled: sky, open: star) | Spatial sky continuum emission | Spatial sky telluric CO2 absorption deviations (filled: H < 10) | |||||||||||||||||||||||
| 0 | 0 |
|
|
|
|
|
|
| IPAIR | NAME | SHIFT | NEWSHIFT | S/N | NAME | SHIFT | NEWSHIFT | S/N |
| 0 | 02630017 | 0.343873 | 0.00000 | 264.216 | 02630019 | -0.0158785 | 0.359751 | 264.106 |
| 1 | 02630020 | 0.330961 | 0.0129120 | 281.491 | 02630022 | -0.0116358 | 0.355509 | 283.010 |
| 2 | 02630024 | 0.321305 | 0.0225680 | 272.546 | 02630015 | 0.00000 | 0.343873 | 282.962 |
| 3 | 02630021 | 0.341501 | 0.00237200 | 266.029 | 02630023 | -0.0141443 | 0.358017 | 275.590 |
| 4 | 02630016 | 0.343671 | 0.000202000 | 257.123 | 02630018 | -0.0128705 | 0.356743 | 260.693 |