| Red | Green | Blue | |
| z | 17.64 | ||
| znorm | Inf | ||
| sky | -Inf | -Inf | -Inf |
| S/N | 20.6 | 35.0 | 40.9 |
| S/N(c) | 0.0 | 0.0 | 0.0 |
| SN(E/C) |


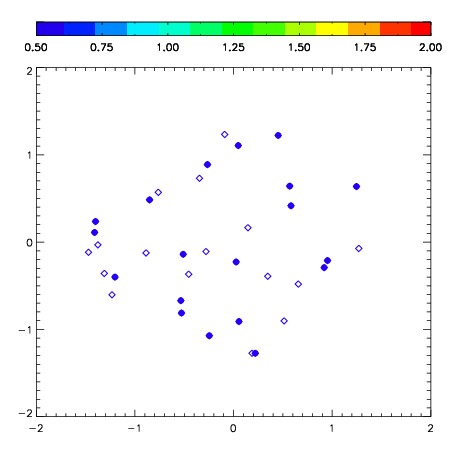
| Frame | Nreads | Zeropoints | Mag plots | Spatial mag deviation | Spatial sky 16325A emission deviations (filled: sky, open: star) | Spatial sky continuum emission | Spatial sky telluric CO2 absorption deviations (filled: H < 10) | |||||||||||||||||||||||
| 0 | 0 |
|
|
|
|
|
|
| IPAIR | NAME | SHIFT | NEWSHIFT | S/N | NAME | SHIFT | NEWSHIFT | S/N |
| 0 | 03340048 | 0.515280 | 0.00000 | 178.297 | 03340054 | 0.0254495 | 0.489830 | 237.434 |
| 1 | 03340052 | 0.507139 | 0.00814098 | 283.347 | 03340051 | 0.0239521 | 0.491328 | 259.048 |
| 2 | 03340053 | 0.505234 | 0.0100460 | 221.757 | 03340050 | 0.0262465 | 0.489034 | 254.579 |
| 3 | 03340049 | 0.515199 | 8.10027e-05 | 113.728 | 03340047 | 0.00000 | 0.515280 | 219.622 |