| Red | Green | Blue | |
| z | 17.64 | ||
| znorm | Inf | ||
| sky | -NaN | -NaN | -Inf |
| S/N | 26.0 | 44.8 | 49.7 |
| S/N(c) | 0.0 | 0.0 | 0.0 |
| SN(E/C) |

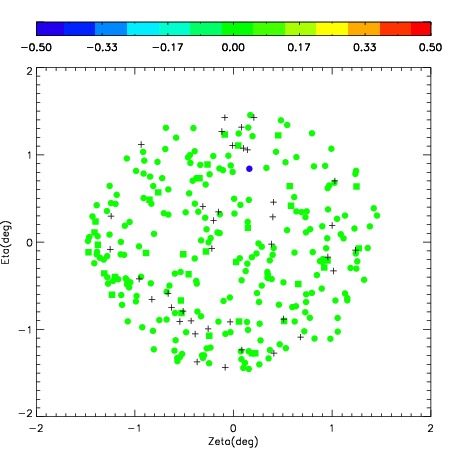
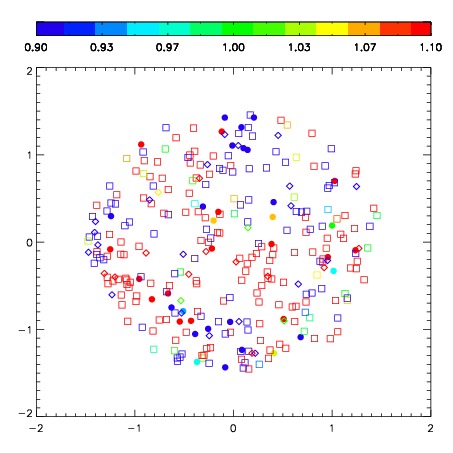

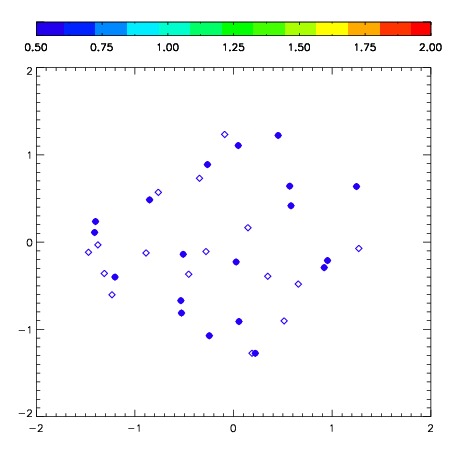
| Frame | Nreads | Zeropoints | Mag plots | Spatial mag deviation | Spatial sky 16325A emission deviations (filled: sky, open: star) | Spatial sky continuum emission | Spatial sky telluric CO2 absorption deviations (filled: H < 10) | |||||||||||||||||||||||
| 0 | 0 |
|
|
|
|
|
|
| IPAIR | NAME | SHIFT | NEWSHIFT | S/N | NAME | SHIFT | NEWSHIFT | S/N |
| 0 | 03410065 | 0.387445 | 0.00000 | 249.887 | 03410063 | -0.0242106 | 0.411656 | 245.111 |
| 1 | 03410060 | 0.367225 | 0.0202200 | 254.472 | 03410066 | -0.0151647 | 0.402610 | 253.265 |
| 2 | 03410064 | 0.372994 | 0.0144510 | 250.666 | 03410062 | -0.0222653 | 0.409710 | 245.353 |
| 3 | 03410061 | 0.383216 | 0.00422901 | 249.351 | 03410059 | 0.00000 | 0.387445 | 243.559 |